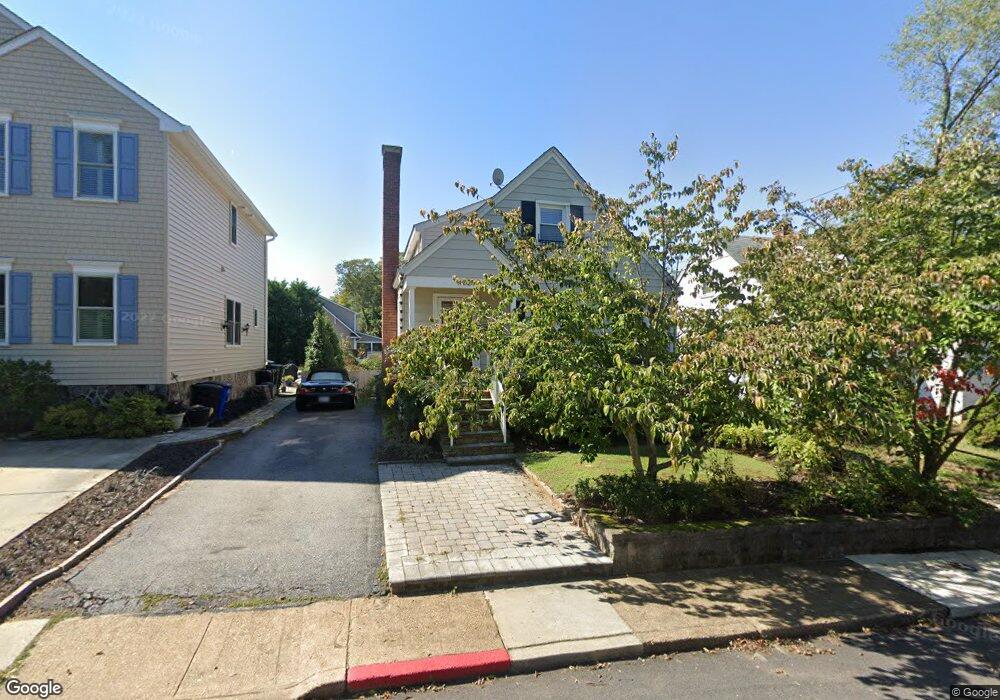
402 Jefferson St Annapolis, MD 21403
Eastport NeighborhoodEstimated Value: $482,501 - $605,000
Studio
1
Bath
1,008
Sq Ft
$551/Sq Ft
Est. Value
About This Home
This home is located at 402 Jefferson St, Annapolis, MD 21403 and is currently estimated at $555,375, approximately $550 per square foot. 402 Jefferson St is a home located in Anne Arundel County with nearby schools including Eastport Elementary School, Annapolis Middle School, and Annapolis High School.
Ownership History
Date
Name
Owned For
Owner Type
Purchase Details
Closed on
Nov 16, 2007
Sold by
Vischer Chad J
Bought by
Johns Joshua S
Current Estimated Value
Home Financials for this Owner
Home Financials are based on the most recent Mortgage that was taken out on this home.
Original Mortgage
$340,000
Outstanding Balance
$215,454
Interest Rate
6.41%
Mortgage Type
Purchase Money Mortgage
Estimated Equity
$339,921
Purchase Details
Closed on
Oct 30, 2007
Sold by
Vischer Chad J
Bought by
Johns Joshua S
Home Financials for this Owner
Home Financials are based on the most recent Mortgage that was taken out on this home.
Original Mortgage
$340,000
Outstanding Balance
$215,454
Interest Rate
6.41%
Mortgage Type
Purchase Money Mortgage
Estimated Equity
$339,921
Purchase Details
Closed on
Dec 13, 2005
Sold by
Yanovitch William J
Bought by
Vischer Chad J
Home Financials for this Owner
Home Financials are based on the most recent Mortgage that was taken out on this home.
Original Mortgage
$278,000
Interest Rate
5.62%
Mortgage Type
Adjustable Rate Mortgage/ARM
Create a Home Valuation Report for This Property
The Home Valuation Report is an in-depth analysis detailing your home's value as well as a comparison with similar homes in the area
Home Values in the Area
Average Home Value in this Area
Purchase History
| Date | Buyer | Sale Price | Title Company |
|---|---|---|---|
| Johns Joshua S | $400,000 | -- | |
| Johns Joshua S | $400,000 | -- | |
| Vischer Chad J | $347,500 | -- |
Source: Public Records
Mortgage History
| Date | Status | Borrower | Loan Amount |
|---|---|---|---|
| Open | Johns Joshua S | $340,000 | |
| Closed | Johns Joshua S | $340,000 | |
| Previous Owner | Vischer Chad J | $278,000 |
Source: Public Records
Tax History
| Year | Tax Paid | Tax Assessment Tax Assessment Total Assessment is a certain percentage of the fair market value that is determined by local assessors to be the total taxable value of land and additions on the property. | Land | Improvement |
|---|---|---|---|---|
| 2025 | $4,912 | $367,433 | -- | -- |
| 2024 | $4,912 | $352,167 | $0 | $0 |
| 2023 | $4,742 | $336,900 | $257,000 | $79,900 |
| 2022 | $4,521 | $325,267 | $0 | $0 |
| 2021 | $4,258 | $313,633 | $0 | $0 |
| 2020 | $4,258 | $302,000 | $221,700 | $80,300 |
| 2019 | $4,261 | $302,000 | $221,700 | $80,300 |
| 2018 | $4,201 | $302,000 | $221,700 | $80,300 |
| 2017 | $3,970 | $304,200 | $0 | $0 |
| 2016 | -- | $304,200 | $0 | $0 |
| 2015 | -- | $304,200 | $0 | $0 |
| 2014 | -- | $321,500 | $0 | $0 |
Source: Public Records
Map
Nearby Homes
- 1007 Park Ave
- 1004 Moss Haven Ct
- 1019 President St
- 1106 Brashears St
- 287 State St Unit 3
- 15 Spa Creek Landing Unit B3
- 1213 Mckinley St
- 2 Southgate Ave Unit 10
- 9 Shipwright St
- 1162 August Dr
- 1113 Primrose Ct Unit 302
- 790 Fairview Ave Unit 790 C
- 1011 Hanson St
- 1002 Tyler Ave
- 51 Franklin St
- 105 Griscom Square Way
- 1388 Primrose Rd
- 755 Fairview Ave Unit 755 D
- 179 Green St
- 320 Chester Ave
- 400 Jefferson St
- 404 Jefferson St
- 406 Jefferson St
- 927 Windsor Ave
- 398 Jefferson St
- 1010 Park Ave
- 932 Windsor Ave
- 411 Jefferson St
- 1008 Park Ave
- 925 Windsor Ave
- 396 Jefferson St
- 926 Windsor Ave
- 307 President Place
- 307 President St
- 923 Windsor Ave
- 1012 Park Ave
- 392 Jefferson St
- 415 Jefferson St
- 397 Jefferson St
- 924 Windsor Ave