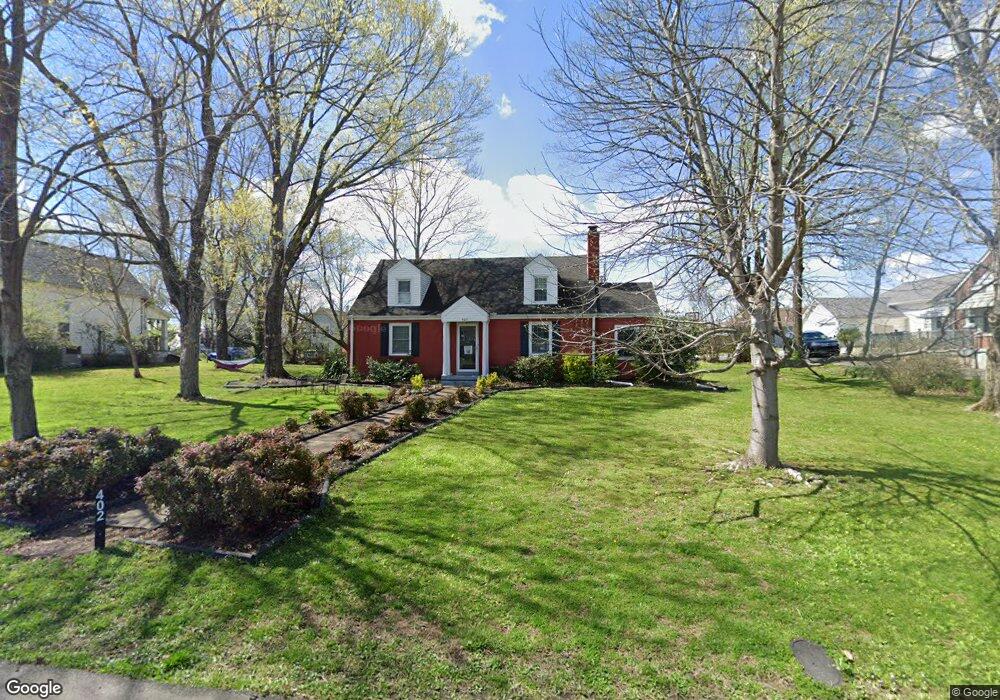
402 Murrell St Dickson, TN 37055
Estimated Value: $335,000 - $396,000
Studio
1
Bath
2,041
Sq Ft
$180/Sq Ft
Est. Value
About This Home
This home is located at 402 Murrell St, Dickson, TN 37055 and is currently estimated at $367,534, approximately $180 per square foot. 402 Murrell St is a home located in Dickson County with nearby schools including Centennial Elementary School, Dickson Middle School, and Dickson County High School.
Ownership History
Date
Name
Owned For
Owner Type
Purchase Details
Closed on
Jul 19, 2019
Sold by
Tigert Jason M
Bought by
Brown Wright Norman and Wright Jennifer Lynn
Current Estimated Value
Home Financials for this Owner
Home Financials are based on the most recent Mortgage that was taken out on this home.
Original Mortgage
$172,000
Outstanding Balance
$150,301
Interest Rate
3.8%
Mortgage Type
New Conventional
Estimated Equity
$217,233
Purchase Details
Closed on
Mar 5, 2013
Sold by
Helton Penny K
Bought by
Tigert Jason M and Tigert Jessica G
Home Financials for this Owner
Home Financials are based on the most recent Mortgage that was taken out on this home.
Original Mortgage
$165,103
Interest Rate
3.56%
Mortgage Type
Commercial
Purchase Details
Closed on
Dec 6, 2002
Sold by
Breeden Sue R
Bought by
Helton Penny K
Purchase Details
Closed on
Mar 16, 1944
Bought by
Breeden J P Mrs
Create a Home Valuation Report for This Property
The Home Valuation Report is an in-depth analysis detailing your home's value as well as a comparison with similar homes in the area
Home Values in the Area
Average Home Value in this Area
Purchase History
| Date | Buyer | Sale Price | Title Company |
|---|---|---|---|
| Brown Wright Norman | $215,000 | -- | |
| Tigert Jason M | $159,000 | -- | |
| Helton Penny K | $118,000 | -- | |
| Breeden J P Mrs | -- | -- |
Source: Public Records
Mortgage History
| Date | Status | Borrower | Loan Amount |
|---|---|---|---|
| Open | Brown Wright Norman | $172,000 | |
| Previous Owner | Tigert Jason M | $165,103 |
Source: Public Records
Tax History
| Year | Tax Paid | Tax Assessment Tax Assessment Total Assessment is a certain percentage of the fair market value that is determined by local assessors to be the total taxable value of land and additions on the property. | Land | Improvement |
|---|---|---|---|---|
| 2025 | -- | $77,550 | $14,375 | $63,175 |
| 2024 | -- | $77,550 | $14,375 | $63,175 |
| 2023 | $1,712 | $54,825 | $8,550 | $46,275 |
| 2022 | $1,712 | $54,825 | $8,550 | $46,275 |
| 2021 | $1,712 | $54,825 | $8,550 | $46,275 |
| 2020 | $1,712 | $54,825 | $8,550 | $46,275 |
| 2019 | $1,712 | $54,825 | $8,550 | $46,275 |
| 2018 | $1,415 | $38,775 | $8,125 | $30,650 |
| 2017 | $1,415 | $38,775 | $8,125 | $30,650 |
| 2016 | $1,415 | $38,775 | $8,125 | $30,650 |
| 2015 | $1,306 | $33,675 | $8,125 | $25,550 |
| 2014 | $1,306 | $33,675 | $8,125 | $25,550 |
Source: Public Records
Map
Nearby Homes
- 110 Mccreary Heights
- 414 W College St
- 0 Truform Way Unit RTC3139035
- 402 W Railroad St
- 202 W College St Unit 4
- 300 W Railroad St
- 108 Aries Aly
- 220 Darlington Dr
- 222 Darlington Dr
- 224 Darlington Dr
- 218 Darlington Dr
- 103 Freeman Ave
- 501 W Chestnut St
- 701 W 5th St
- 104 W Chestnut St
- 402 S Mulberry St
- 806 Dotson Aly
- 412 E Rickert Ave
- 0 Country Club Dr Unit 26
- 0 Henslee Dr Spring St Unit RTC3128657
- 404 Murrell St
- 400 Murrell St
- 406 Murrell St
- 405 W College St
- 401 Murrell St
- 405 Murrell St
- 407 W College St
- 403 W College St
- 408 Murrell St
- 409 W College St
- 103 Nesbitt St
- 407 Murrell St
- 310 Murrell St
- 311 Murrell St
- 309 W College St
- 409 Murrell St
- 101 Nesbitt St
- 406 W College St
- 404 W College St
- 404 W College St Unit A
Your Personal Tour Guide
Ask me questions while you tour the home.