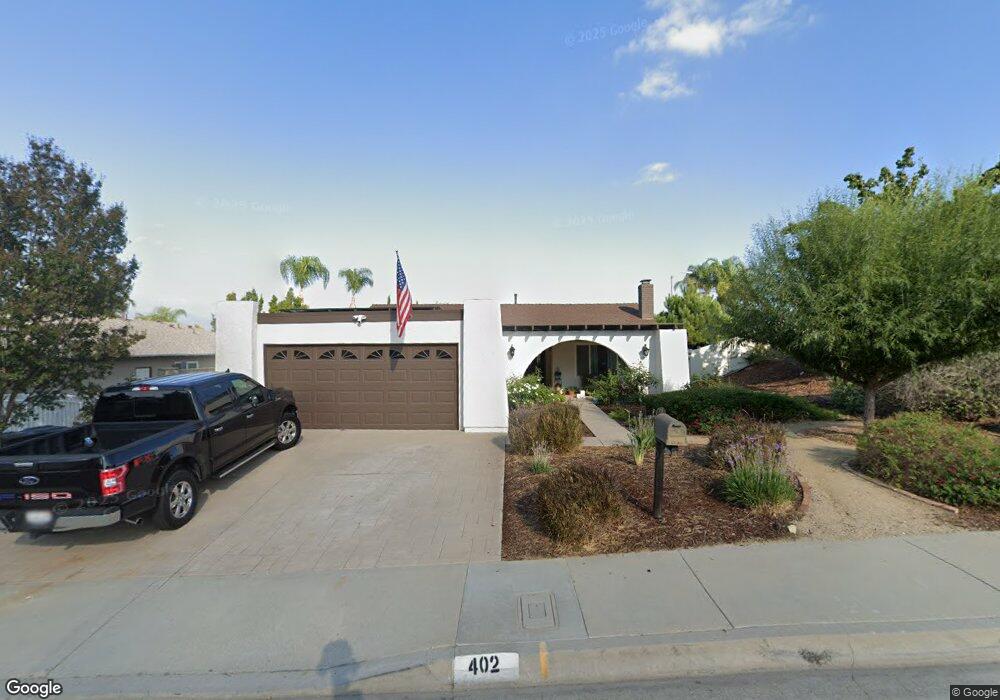
402 Red Cloud Dr Diamond Bar, CA 91765
Estimated Value: $912,329 - $987,000
3
Beds
2
Baths
1,996
Sq Ft
$480/Sq Ft
Est. Value
About This Home
This home is located at 402 Red Cloud Dr, Diamond Bar, CA 91765 and is currently estimated at $957,582, approximately $479 per square foot. 402 Red Cloud Dr is a home located in Los Angeles County with nearby schools including Armstrong Elementary School, Lorbeer Middle School, and Diamond Ranch High School.
Ownership History
Date
Name
Owned For
Owner Type
Purchase Details
Closed on
Oct 6, 2016
Sold by
Hilliard David and Hilliard Patricia
Bought by
Hilliard David and Hilliard Patricia
Current Estimated Value
Purchase Details
Closed on
Jul 9, 2003
Sold by
Stark Leonard J and Stark Leonard John
Bought by
Hilliard David and Hilliard Patricia R
Home Financials for this Owner
Home Financials are based on the most recent Mortgage that was taken out on this home.
Original Mortgage
$223,850
Outstanding Balance
$92,078
Interest Rate
5.29%
Mortgage Type
Purchase Money Mortgage
Estimated Equity
$865,504
Purchase Details
Closed on
Nov 17, 1998
Sold by
Moniaga Tony and Moniaga Esther M
Bought by
Stark Leonard John
Home Financials for this Owner
Home Financials are based on the most recent Mortgage that was taken out on this home.
Original Mortgage
$224,850
Interest Rate
6.82%
Create a Home Valuation Report for This Property
The Home Valuation Report is an in-depth analysis detailing your home's value as well as a comparison with similar homes in the area
Home Values in the Area
Average Home Value in this Area
Purchase History
| Date | Buyer | Sale Price | Title Company |
|---|---|---|---|
| Hilliard David | -- | None Available | |
| Hilliard David | $425,000 | Fidelity National Title | |
| Stark Leonard John | $237,000 | Fidelity National Title Co |
Source: Public Records
Mortgage History
| Date | Status | Borrower | Loan Amount |
|---|---|---|---|
| Open | Hilliard David | $223,850 | |
| Previous Owner | Stark Leonard John | $224,850 |
Source: Public Records
Tax History
| Year | Tax Paid | Tax Assessment Tax Assessment Total Assessment is a certain percentage of the fair market value that is determined by local assessors to be the total taxable value of land and additions on the property. | Land | Improvement |
|---|---|---|---|---|
| 2025 | $7,656 | $604,241 | $375,058 | $229,183 |
| 2024 | $7,656 | $592,394 | $367,704 | $224,690 |
| 2023 | $7,508 | $580,780 | $360,495 | $220,285 |
| 2022 | $7,391 | $569,393 | $353,427 | $215,966 |
| 2021 | $7,224 | $558,230 | $346,498 | $211,732 |
| 2019 | $7,379 | $541,674 | $336,222 | $205,452 |
| 2018 | $6,817 | $531,054 | $329,630 | $201,424 |
| 2016 | $6,395 | $510,434 | $316,831 | $193,603 |
| 2015 | $6,340 | $502,767 | $312,072 | $190,695 |
| 2014 | $6,151 | $481,000 | $299,000 | $182,000 |
Source: Public Records
Map
Nearby Homes
- 312 N Prospectors Rd
- 22942 Sunset Crossing Rd
- 23628 Decorah Rd
- 23675 Bower Cascade Place
- 23611 Golden Springs Dr Unit I12
- 605 Acolito Place
- 300 S Prospectors Rd Unit 29
- 23601 Golden Springs Dr
- 353 S Rock River Rd
- 23836 Minnequa Dr
- 23847 Bower Cascade Place
- 22129 Portofino Dr
- 22092 Portofino Dr
- 22070 Portofino Dr
- 23848 Sunset Crossing Rd
- 22085 Manarola Way
- 22060 Manarola Way
- 22058 Manarola Way
- 23777 Highland Valley Rd
- 22059 Tuscany Ct
- 408 Red Cloud Dr
- 23004 Haddock St
- 23010 Haddock St
- 416 Red Cloud Dr
- 23002 Lela Dr
- 23016 Haddock St
- 23008 Lela Dr
- 23020 Lela Dr
- 401 Red Cloud Dr
- 407 Red Cloud Dr
- 23000 Haddock St
- 325 Red Cloud Dr
- 23022 Haddock St
- 23014 Lela Dr
- 413 Red Cloud Dr
- 315 Red Cloud Dr
- 23003 Mink Dr
- 421 Red Cloud Dr
- 23028 Haddock St
- 434 Red Cloud Dr
Your Personal Tour Guide
Ask me questions while you tour the home.