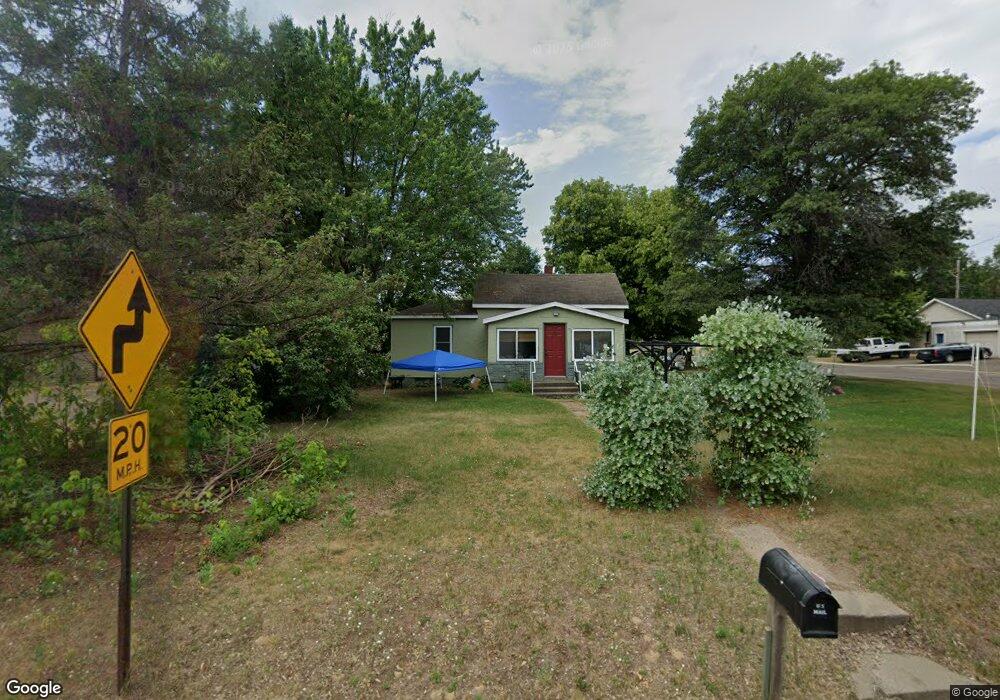
402 SW 4th St Brainerd, MN 56401
Estimated Value: $176,075 - $210,000
2
Beds
1
Bath
1,040
Sq Ft
$187/Sq Ft
Est. Value
About This Home
This home is located at 402 SW 4th St, Brainerd, MN 56401 and is currently estimated at $194,019, approximately $186 per square foot. 402 SW 4th St is a home located in Crow Wing County with nearby schools including Riverside Elementary School, Forestview Middle School, and Brainerd Senior High School.
Ownership History
Date
Name
Owned For
Owner Type
Purchase Details
Closed on
Dec 1, 2007
Sold by
Vlaminck Tracey J
Bought by
Armstrong Benjamin C and Armstrong Amanda
Current Estimated Value
Purchase Details
Closed on
Jun 1, 2007
Bought by
Vlaminck Tracey J
Purchase Details
Closed on
Nov 1, 2003
Sold by
Ylinen Chad and Ylinen Brooke
Bought by
Perlberg Craig and Perlberg Lisa
Purchase Details
Closed on
Apr 1, 1999
Sold by
Strong Jack H
Bought by
Ylinen Chad D
Purchase Details
Closed on
Aug 1, 1995
Sold by
Wjeishofski Rit
Bought by
Strong Jack H J
Create a Home Valuation Report for This Property
The Home Valuation Report is an in-depth analysis detailing your home's value as well as a comparison with similar homes in the area
Home Values in the Area
Average Home Value in this Area
Purchase History
We collect this data history from publicly available records. To have your information removed, we recommend requesting removal directly through your county’s website.
| Date | Buyer | Sale Price | Title Company |
|---|---|---|---|
| Armstrong Benjamin C | $94,900 | -- | |
| Vlaminck Tracey J | $75,000 | -- | |
| Perlberg Craig | $97,500 | -- | |
| Ylinen Chad D | $52,000 | -- | |
| Strong Jack H J | $45,500 | -- |
Source: Public Records
Tax History
| Year | Tax Paid | Tax Assessment Tax Assessment Total Assessment is a certain percentage of the fair market value that is determined by local assessors to be the total taxable value of land and additions on the property. | Land | Improvement |
|---|---|---|---|---|
| 2025 | $1,256 | $147,200 | $49,400 | $97,800 |
| 2024 | $1,222 | $144,000 | $45,000 | $99,000 |
| 2023 | $1,248 | $125,200 | $41,800 | $83,400 |
| 2022 | $1,174 | $120,700 | $38,000 | $82,700 |
| 2021 | $1,154 | $97,400 | $32,700 | $64,700 |
| 2020 | $1,048 | $93,000 | $32,700 | $60,300 |
| 2019 | $1,022 | $83,100 | $32,700 | $50,400 |
| 2018 | $1,064 | $81,000 | $32,600 | $48,400 |
| 2017 | $824 | $56,500 | $21,417 | $35,083 |
| 2016 | $804 | $38,800 | $16,000 | $22,800 |
| 2015 | $746 | $34,700 | $13,000 | $21,700 |
| 2014 | $471 | $50,500 | $12,800 | $37,700 |
Source: Public Records
Map
Nearby Homes
- 206 SW 7th St
- 000 Colonywood Ln
- 0 W Washington St
- 801 S 6th St
- 1016 S 6th St
- 324 Juniper St
- 713 S 7th St
- 1518 Pennsylvania Ave
- 1524 Pennsylvania Ave
- 0 Fairview Rd
- 1021 S 7th St
- 519 S 9th St
- 1415 S 6th St
- TBD Excelsior Rd
- 721 N 3rd St
- 1422 S 7th St
- 1507 S 6th St
- TBD Eagle Ridge
- 1624 Graydon Ave
- 8100 Dalton Rd
Your Personal Tour Guide
Ask me questions while you tour the home.