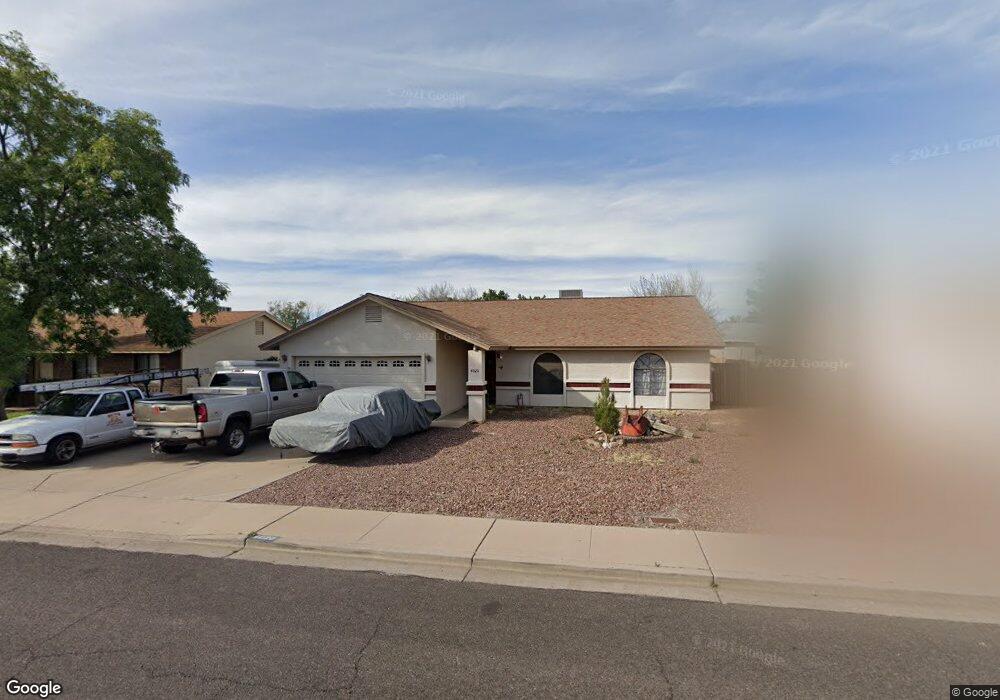
4020 E Dover St Mesa, AZ 85205
The Groves NeighborhoodEstimated Value: $372,140 - $450,000
Studio
2
Baths
1,423
Sq Ft
$300/Sq Ft
Est. Value
About This Home
This home is located at 4020 E Dover St, Mesa, AZ 85205 and is currently estimated at $426,785, approximately $299 per square foot. 4020 E Dover St is a home located in Maricopa County with nearby schools including Entz Elementary School, Franklin at Brimhall Elementary School, and Franklin West Elementary School.
Ownership History
Date
Name
Owned For
Owner Type
Purchase Details
Closed on
Jul 1, 2010
Sold by
Ray Alice Lee
Bought by
Ray Douglas J
Current Estimated Value
Purchase Details
Closed on
Jul 25, 2002
Sold by
Ray Robert P and Ray Margaret J
Bought by
Ray Douglas J
Home Financials for this Owner
Home Financials are based on the most recent Mortgage that was taken out on this home.
Original Mortgage
$60,800
Interest Rate
6.6%
Mortgage Type
New Conventional
Create a Home Valuation Report for This Property
The Home Valuation Report is an in-depth analysis detailing your home's value as well as a comparison with similar homes in the area
Home Values in the Area
Average Home Value in this Area
Purchase History
| Date | Buyer | Sale Price | Title Company |
|---|---|---|---|
| Ray Douglas J | -- | None Available | |
| Ray Douglas J | $76,000 | First American Title Ins Co |
Source: Public Records
Mortgage History
| Date | Status | Borrower | Loan Amount |
|---|---|---|---|
| Closed | Ray Douglas J | $60,800 |
Source: Public Records
Tax History
| Year | Tax Paid | Tax Assessment Tax Assessment Total Assessment is a certain percentage of the fair market value that is determined by local assessors to be the total taxable value of land and additions on the property. | Land | Improvement |
|---|---|---|---|---|
| 2025 | $1,338 | $15,653 | -- | -- |
| 2024 | $1,352 | $14,908 | -- | -- |
| 2023 | $1,352 | $29,000 | $5,800 | $23,200 |
| 2022 | $1,323 | $22,530 | $4,500 | $18,030 |
| 2021 | $1,352 | $21,480 | $4,290 | $17,190 |
| 2020 | $1,333 | $19,600 | $3,920 | $15,680 |
| 2019 | $1,238 | $17,610 | $3,520 | $14,090 |
| 2018 | $1,180 | $16,020 | $3,200 | $12,820 |
| 2017 | $1,144 | $14,770 | $2,950 | $11,820 |
| 2016 | $1,123 | $14,180 | $2,830 | $11,350 |
| 2015 | $1,058 | $13,320 | $2,660 | $10,660 |
Source: Public Records
Map
Nearby Homes
- 4021 E Des Moines St
- 625 N 38th St
- 730 N Oakland
- 4065 E University Dr Unit 157
- 3746 E Dartmouth St
- 3716 E Dartmouth St
- 3721 E Adobe St
- 4065 E University Dr Unit 433
- 4065 E University Dr Unit 50
- 4065 E University Dr Unit 430
- 4065 E University Dr Unit 136
- 4065 E University Dr Unit 516
- 4065 E University Dr Unit 456
- 4065 E University Dr Unit 344
- 4065 E University Dr Unit 58
- 4065 E University Dr Unit 285
- 4065 E University Dr Unit 332
- 4065 E University Dr Unit 526
- 4065 E University Dr Unit 528
- 4065 E University Dr Unit 83
- 4028 E Dover St
- 4012 E Dover St
- 4013 E Des Moines St
- 4029 E Des Moines*total Remodel**
- 4029 E Des Moines St
- 4004 E Dover St
- 4019 E Dover St
- 4027 E Dover St
- 4011 E Dover St
- 4037 E Des Moines St
- 4005 E Des Moines St
- 4044 E Dover St
- 4035 E Dover St
- 4003 E Dover St
- 4045 E Des Moines St
- 4022 E Des Moines St
- 4043 E Dover St
- 4052 E Dover St
- 4018 E Decatur St
- 636 N Nassau
Your Personal Tour Guide
Ask me questions while you tour the home.