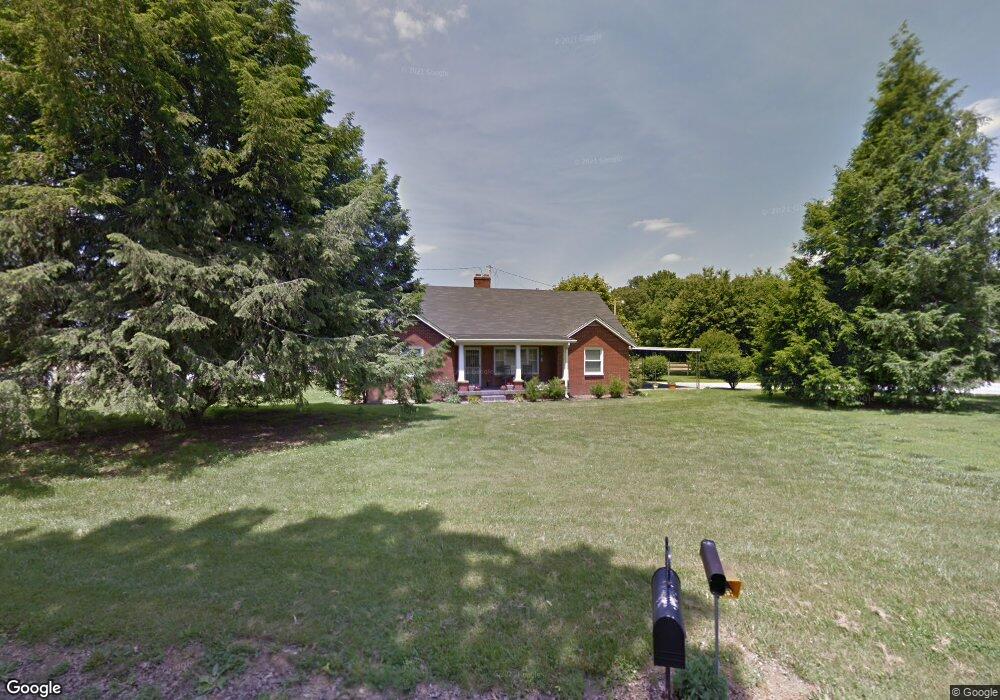
4020 Wells Rd Springfield, TN 37172
Estimated Value: $889,000
--
Bed
1
Bath
--
Sq Ft
187.8
Acres
About This Home
This home is located at 4020 Wells Rd, Springfield, TN 37172 and is currently priced at $889,000. 4020 Wells Rd is a home located in Robertson County with nearby schools including East Robertson Elementary School and East Robertson High School.
Ownership History
Date
Name
Owned For
Owner Type
Purchase Details
Closed on
Apr 25, 2025
Sold by
Wells Lu Ann and Williams Nancy M
Bought by
Wells
Current Estimated Value
Purchase Details
Closed on
Dec 18, 2023
Sold by
Newland Scott D and Newland Tommie L
Bought by
Newland Scott D and Newland Tommie L
Purchase Details
Closed on
Oct 30, 2023
Sold by
Fisher Wanda W and Lu Ann
Bought by
Newland Scott D and Newland Tommie L
Purchase Details
Closed on
Mar 1, 2016
Sold by
Fisher Erin T
Bought by
Fisher Jonathan W
Purchase Details
Closed on
May 17, 2011
Sold by
Fisher Wanda W
Bought by
Fisher Jonathan W
Purchase Details
Closed on
Sep 6, 2007
Sold by
Jonathan Fisher
Bought by
Jonathan Fisher
Purchase Details
Closed on
Aug 22, 2007
Sold by
Jo Wells Mary
Bought by
Fisher Jonathan W
Purchase Details
Closed on
Jun 14, 2007
Sold by
Fisher Wanda W
Bought by
Jonathan Fisher
Purchase Details
Closed on
Aug 10, 1988
Bought by
Fisher Wanda W and Wells Luann
Purchase Details
Closed on
Feb 26, 1974
Bought by
Wells Jack C
Create a Home Valuation Report for This Property
The Home Valuation Report is an in-depth analysis detailing your home's value as well as a comparison with similar homes in the area
Home Values in the Area
Average Home Value in this Area
Purchase History
| Date | Buyer | Sale Price | Title Company |
|---|---|---|---|
| Wells | -- | None Listed On Document | |
| Wells | -- | None Listed On Document | |
| Newland Scott D | -- | None Listed On Document | |
| Williams Nancy Melinda | -- | None Listed On Document | |
| Newland Scott D | -- | None Listed On Document | |
| Fisher Jonathan W | -- | -- | |
| Fisher Jonathan W | $50,000 | -- | |
| Jonathan Fisher | -- | -- | |
| Fisher Jonathan W | -- | -- | |
| Jonathan Fisher | -- | -- | |
| Fisher Wanda W | -- | -- | |
| Wells Jack C | -- | -- |
Source: Public Records
Tax History Compared to Growth
Tax History
| Year | Tax Paid | Tax Assessment Tax Assessment Total Assessment is a certain percentage of the fair market value that is determined by local assessors to be the total taxable value of land and additions on the property. | Land | Improvement |
|---|---|---|---|---|
| 2024 | $1,837 | $102,050 | $82,800 | $19,250 |
| 2023 | $1,865 | $103,625 | $84,375 | $19,250 |
| 2022 | $2,120 | $82,300 | $64,900 | $17,400 |
| 2021 | $1,871 | $72,650 | $64,900 | $7,750 |
| 2020 | $1,871 | $72,650 | $64,900 | $7,750 |
| 2019 | $1,874 | $72,650 | $64,900 | $7,750 |
| 2018 | $2,074 | $80,525 | $71,525 | $9,000 |
| 2017 | $2,019 | $65,450 | $55,975 | $9,475 |
| 2016 | $2,019 | $65,450 | $55,975 | $9,475 |
| 2015 | $2,220 | $75,000 | $55,975 | $19,025 |
| 2014 | $2,778 | $93,850 | $60,800 | $33,050 |
Source: Public Records
Map
Nearby Homes
- 3972 Baggett Rd
- 4002 Baggett Rd
- 3966 Baggett Rd
- 12354 Owens Chapel Rd
- 6012 Bethlehem Rd
- 1074 Pair Six Dr
- 6809 Lovel Cook Rd
- 4844 Homer Worsham Rd
- 7855 Bethlehem Rd
- 0 Homer Worsham Rd
- 0 Woodrow Wilson Rd
- 7452 Chowning Rd
- 6838 Highway 76 E
- 4540 Roy Cole Rd
- 4616 Woodrow Wilson Rd
- 7956 Bethlehem Rd
- 6615 Herbert Shannon Rd
- 1004 Shiloh Dr
- 6015 Highway 76 E
- 6241 Green Rd
- 4038 Wells Rd
- 3950 Wells Rd
- 4051 Wells Rd
- 4060 Wells Rd
- 3975 Wells Rd
- 4031 Wells Rd
- 4067 Wells Rd
- 3910 Baggett Rd
- 3920 Baggett Rd
- 3774 Baggett Rd
- 3924 Wells Rd
- 3844 Baggett Rd
- 3890 Baggett Rd
- 3916 Baggett Rd
- 3778 Baggett Rd
- 3956 Baggett Rd
- 4134 Wells Rd
- 3941 Baggett Rd
- 4006 Baggett Rd
- 3788 Baggett Rd