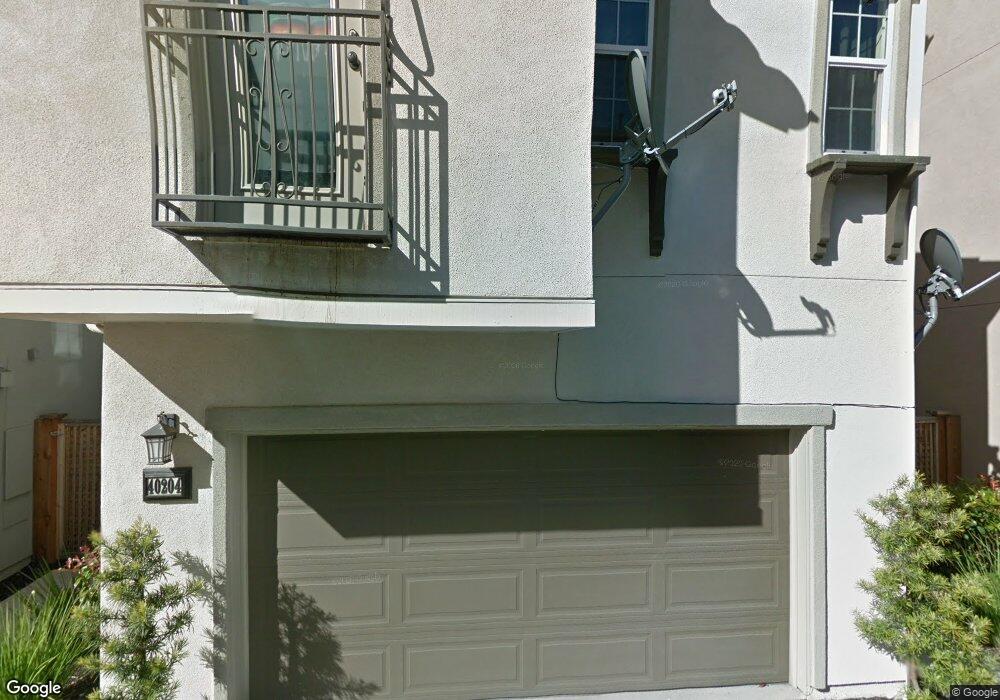
40204 Antigua Rose Terrace Fremont, CA 94538
Sundale NeighborhoodEstimated Value: $1,388,228 - $1,694,000
3
Beds
3
Baths
2,000
Sq Ft
$769/Sq Ft
Est. Value
About This Home
This home is located at 40204 Antigua Rose Terrace, Fremont, CA 94538 and is currently estimated at $1,538,807, approximately $769 per square foot. 40204 Antigua Rose Terrace is a home located in Alameda County with nearby schools including John Blacow Elementary School, G.M. Walters Middle School, and John F. Kennedy High School.
Ownership History
Date
Name
Owned For
Owner Type
Purchase Details
Closed on
Aug 29, 2011
Sold by
Palomo Javier
Bought by
Knox Noreen G
Current Estimated Value
Purchase Details
Closed on
Aug 26, 2011
Sold by
Knox Noreen G and Cludadano George N
Bought by
Knox Noreen G and Ciudadano George N
Purchase Details
Closed on
Sep 23, 2008
Sold by
Summerhill Rosewood Llc
Bought by
Knox Noreen Gay C and Ciudadano George Neil
Home Financials for this Owner
Home Financials are based on the most recent Mortgage that was taken out on this home.
Original Mortgage
$669,900
Outstanding Balance
$444,937
Interest Rate
6.49%
Mortgage Type
FHA
Estimated Equity
$1,093,870
Create a Home Valuation Report for This Property
The Home Valuation Report is an in-depth analysis detailing your home's value as well as a comparison with similar homes in the area
Home Values in the Area
Average Home Value in this Area
Purchase History
| Date | Buyer | Sale Price | Title Company |
|---|---|---|---|
| Knox Noreen G | -- | First American Title Company | |
| Knox Noreen G | -- | First American Title Company | |
| Knox Noreen Gay C | $695,000 | First American Title Company |
Source: Public Records
Mortgage History
| Date | Status | Borrower | Loan Amount |
|---|---|---|---|
| Open | Knox Noreen Gay C | $669,900 |
Source: Public Records
Tax History Compared to Growth
Tax History
| Year | Tax Paid | Tax Assessment Tax Assessment Total Assessment is a certain percentage of the fair market value that is determined by local assessors to be the total taxable value of land and additions on the property. | Land | Improvement |
|---|---|---|---|---|
| 2025 | $10,608 | $887,930 | $268,479 | $626,451 |
| 2024 | $10,608 | $870,388 | $263,216 | $614,172 |
| 2023 | $10,327 | $860,187 | $258,056 | $602,131 |
| 2022 | $10,262 | $836,326 | $252,998 | $590,328 |
| 2021 | $10,009 | $819,791 | $248,037 | $578,754 |
| 2020 | $10,042 | $818,320 | $245,496 | $572,824 |
| 2019 | $9,927 | $802,280 | $240,684 | $561,596 |
| 2018 | $9,733 | $786,551 | $235,965 | $550,586 |
| 2017 | $9,489 | $771,130 | $231,339 | $539,791 |
| 2016 | $9,328 | $756,013 | $226,804 | $529,209 |
| 2015 | $9,204 | $744,664 | $223,399 | $521,265 |
| 2014 | $8,456 | $680,000 | $204,000 | $476,000 |
Source: Public Records
Map
Nearby Homes
- 4453 Porter St
- 40116 Crockett St
- 4421 Cahill St
- 4555 Stevenson Blvd
- 40702 Greystone Terrace Unit 9
- 4840 Piper St
- 4214 Providence Terrace
- 4737 Boone Dr
- 39993 Fremont Blvd Unit 102
- 4463 Hyde Common Unit 306
- 39850 Sundale Dr
- 4600 Nelson St
- 4310 Providence Terrace
- 40696 Robin St
- 3909 Stevenson Blvd Unit 402
- 40422 Landon Ave
- 4751 Wadsworth Ct
- 40708 Fremont Blvd
- 3695 Stevenson Blvd Unit E206
- 40769 Squill Common
- 40206 Antigua Rose Terrace
- 40202 Antigua Rose Terrace
- 40200 Antigua Rose Terrace
- 40208 Antigua Rose Terrace Unit 481
- 40210 Antigua Rose Terrace
- 40235 Legend Rose Terrace
- 40227 Legend Rose Terrace Unit 542
- 40231 Legend Rose Terrace Unit 541
- 40239 Legend Rose Terrace
- 40203 Antigua Rose Terrace Unit 422
- 40205 Antigua Rose Terrace Unit 421
- 40207 Antigua Rose Terrace
- 40223 Legend Rose Terrace
- 40209 Antigua Rose Terrace
- 40201 Antigua Rose Terrace
- 40243 Legend Rose Terrace
- 40212 Antigua Rose Terrace
- 40211 Antigua Rose Terrace
- 40247 Legend Rose Terrace
- 40213 Antigua Rose Terrace