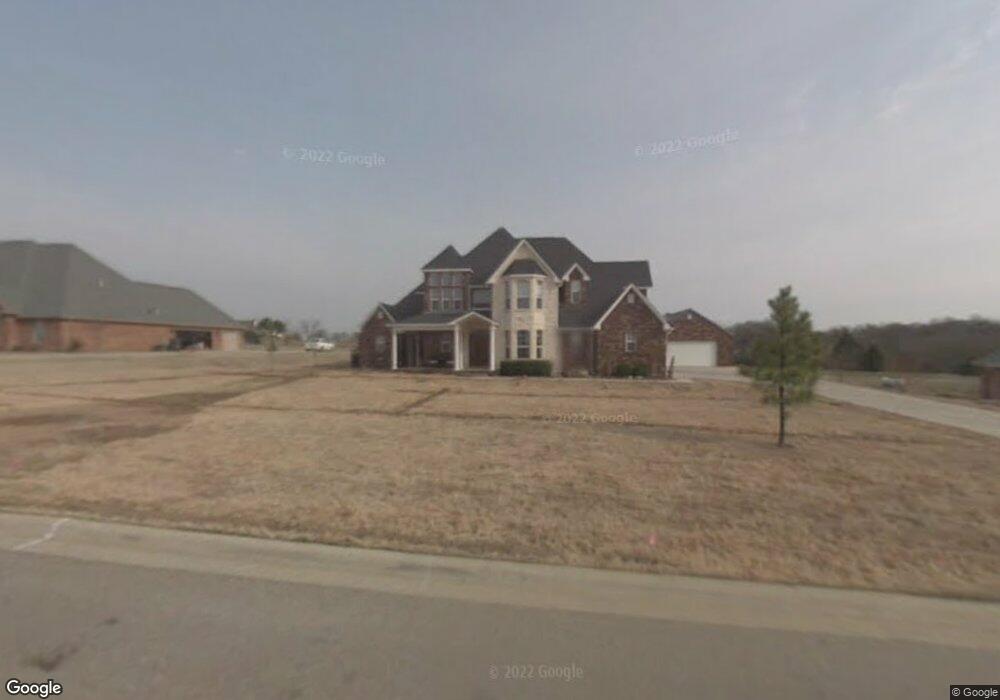
4021 Rolling Hills Dr Ardmore, OK 73401
Estimated Value: $327,000 - $717,663
4
Beds
4
Baths
3,897
Sq Ft
$145/Sq Ft
Est. Value
About This Home
This home is located at 4021 Rolling Hills Dr, Ardmore, OK 73401 and is currently estimated at $566,888, approximately $145 per square foot. 4021 Rolling Hills Dr is a home located in Carter County with nearby schools including Plainview Primary School, Plainview Intermediate School, and Plainview Middle School.
Ownership History
Date
Name
Owned For
Owner Type
Purchase Details
Closed on
Apr 7, 2020
Sold by
Richard James Peter
Bought by
Harbour Josey D and Harbour Ashley M
Current Estimated Value
Home Financials for this Owner
Home Financials are based on the most recent Mortgage that was taken out on this home.
Original Mortgage
$161,912
Outstanding Balance
$142,530
Interest Rate
3.3%
Mortgage Type
FHA
Estimated Equity
$424,358
Purchase Details
Closed on
Jun 28, 2005
Sold by
Wright Robert S and Wright Betsy A
Bought by
Watkins Steven K and Watkins Mistye R
Home Financials for this Owner
Home Financials are based on the most recent Mortgage that was taken out on this home.
Original Mortgage
$349,600
Interest Rate
5.67%
Mortgage Type
New Conventional
Purchase Details
Closed on
Sep 12, 2001
Sold by
Barrick Leslie R and Barrick Chri
Bought by
Wright Robert S and Wright Betsy
Purchase Details
Closed on
Jan 5, 2001
Sold by
Plainview Development
Bought by
Barrick Christopher G And
Create a Home Valuation Report for This Property
The Home Valuation Report is an in-depth analysis detailing your home's value as well as a comparison with similar homes in the area
Home Values in the Area
Average Home Value in this Area
Purchase History
| Date | Buyer | Sale Price | Title Company |
|---|---|---|---|
| Harbour Josey D | $165,000 | None Available | |
| Watkins Steven K | $368,000 | -- | |
| Wright Robert S | $20,500 | -- | |
| Barrick Christopher G And | $23,000 | -- |
Source: Public Records
Mortgage History
| Date | Status | Borrower | Loan Amount |
|---|---|---|---|
| Open | Harbour Josey D | $161,912 | |
| Previous Owner | Watkins Steven K | $349,600 |
Source: Public Records
Tax History Compared to Growth
Tax History
| Year | Tax Paid | Tax Assessment Tax Assessment Total Assessment is a certain percentage of the fair market value that is determined by local assessors to be the total taxable value of land and additions on the property. | Land | Improvement |
|---|---|---|---|---|
| 2025 | $6,990 | $80,073 | $5,700 | $74,373 |
| 2024 | $6,990 | $76,259 | $5,691 | $70,568 |
| 2023 | $6,657 | $72,629 | $5,682 | $66,947 |
| 2022 | $6,265 | $69,171 | $5,657 | $63,514 |
| 2021 | $6,138 | $65,877 | $5,633 | $60,244 |
| 2020 | $5,907 | $62,739 | $5,344 | $57,395 |
| 2019 | $5,480 | $59,752 | $5,103 | $54,649 |
| 2018 | $5,168 | $56,906 | $4,813 | $52,093 |
| 2017 | $4,945 | $54,197 | $4,535 | $49,662 |
| 2016 | $4,736 | $51,617 | $4,279 | $47,338 |
| 2015 | $4,641 | $49,158 | $2,760 | $46,398 |
| 2014 | $4,420 | $46,817 | $2,760 | $44,057 |
Source: Public Records
Map
Nearby Homes
- 4101 Rolling Hills Dr
- 3921 Rolling Hills Dr
- 610 Sundance Dr
- 4105 Meadowlark Rd
- 714 Prairie View Rd
- 4110 Meadowlark Rd
- 3542 Highland Oaks Cir
- 808 Prairie View Rd
- 3541 Highland Oaks Cir
- 816 Boulder Dr
- 913 Prairie View Rd
- 1013 Prairie View Rd
- 0 N Plainview Rd Unit 23990353
- 0 W Broadway St Unit 2501343
- 3501 W Broadway St
- 3218 W Broadway St
- 1022 Indian Plains Rd
- 925 Indian Plains Rd
- 921 Indian Plains Rd
- 3209 Myall St
- 4011 Rolling Hills Dr
- 4031 Rolling Hills Dr
- 3931 Rolling Hills Dr
- 4030 Rolling Hills Dr
- 4020 Rolling Hills Dr
- 4010 Rolling Hills Dr
- 4124 Hess Rd
- 602 Sundance Dr
- 4106 Rolling Hills Dr
- 609 Sundance Dr
- 610 Prairie View Rd
- 610 Prairie View Rd
- 610 Prairie Valley Rd
- 4109 Rolling Hills Dr
- 705 S Plainview Rd
- 3911 Rolling Hills Dr
- 606 Sundance Dr
- 4110 Rolling Hills Dr
- 4202 Hess Rd
- 616 Prairie Valley Rd