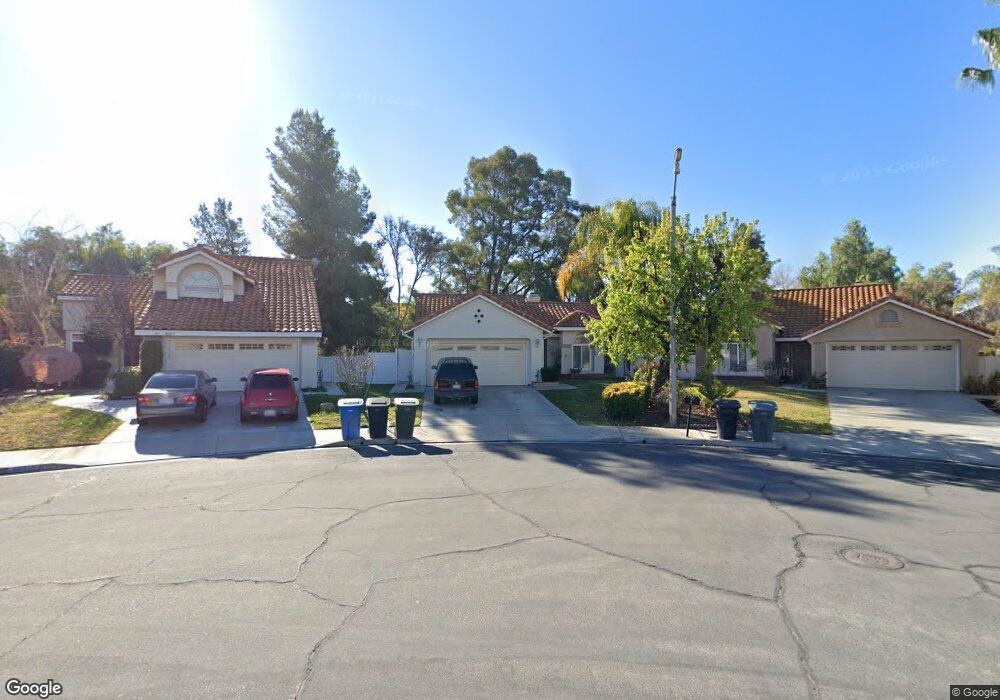
40223 Mimulus Way Temecula, CA 92591
Roripaugh Hills NeighborhoodEstimated Value: $467,000 - $548,000
2
Beds
2
Baths
1,077
Sq Ft
$483/Sq Ft
Est. Value
About This Home
This home is located at 40223 Mimulus Way, Temecula, CA 92591 and is currently estimated at $520,592, approximately $483 per square foot. 40223 Mimulus Way is a home located in Riverside County with nearby schools including Nicolas Valley Elementary School, James L. Day Middle School, and Chaparral High School.
Ownership History
Date
Name
Owned For
Owner Type
Purchase Details
Closed on
Jan 9, 2002
Sold by
Barron David and Barron Laura K
Bought by
Casanova Lydia A
Current Estimated Value
Home Financials for this Owner
Home Financials are based on the most recent Mortgage that was taken out on this home.
Original Mortgage
$171,900
Outstanding Balance
$69,412
Interest Rate
7.17%
Mortgage Type
Stand Alone First
Estimated Equity
$451,180
Purchase Details
Closed on
May 2, 1997
Sold by
Federal National Mortgage Association
Bought by
Barron David and Barron Laura K
Home Financials for this Owner
Home Financials are based on the most recent Mortgage that was taken out on this home.
Original Mortgage
$97,000
Interest Rate
7.98%
Mortgage Type
Seller Take Back
Purchase Details
Closed on
Jan 10, 1997
Sold by
Bowers Jeffrey D
Bought by
Federal National Mortgage Association
Create a Home Valuation Report for This Property
The Home Valuation Report is an in-depth analysis detailing your home's value as well as a comparison with similar homes in the area
Home Values in the Area
Average Home Value in this Area
Purchase History
| Date | Buyer | Sale Price | Title Company |
|---|---|---|---|
| Casanova Lydia A | $172,000 | First American Title Co | |
| Barron David | $100,000 | Chicago Title | |
| Federal National Mortgage Association | $101,650 | First Southwestern Title Co |
Source: Public Records
Mortgage History
| Date | Status | Borrower | Loan Amount |
|---|---|---|---|
| Open | Casanova Lydia A | $171,900 | |
| Previous Owner | Barron David | $97,000 |
Source: Public Records
Tax History
| Year | Tax Paid | Tax Assessment Tax Assessment Total Assessment is a certain percentage of the fair market value that is determined by local assessors to be the total taxable value of land and additions on the property. | Land | Improvement |
|---|---|---|---|---|
| 2025 | $3,169 | $253,914 | $66,463 | $187,451 |
| 2023 | $3,169 | $244,056 | $63,883 | $180,173 |
| 2022 | $3,062 | $239,272 | $62,631 | $176,641 |
| 2021 | $2,991 | $234,581 | $61,403 | $173,178 |
| 2020 | $2,956 | $232,177 | $60,774 | $171,403 |
| 2019 | $2,910 | $227,626 | $59,583 | $168,043 |
| 2018 | $2,848 | $223,164 | $58,415 | $164,749 |
| 2017 | $2,793 | $218,789 | $57,270 | $161,519 |
| 2016 | $2,740 | $214,500 | $56,148 | $158,352 |
| 2015 | $2,689 | $211,279 | $55,305 | $155,974 |
| 2014 | $2,604 | $207,143 | $54,223 | $152,920 |
Source: Public Records
Map
Nearby Homes
- 40243 Mimulus Way
- 27590 Nellie Ct
- 27536 Swallow Ct
- 27546 Senna Ct
- 40591 Chantemar Way
- 29928 Valle Olvera
- 29049 Portland Ct
- 39560 Linnit Cir
- 41070 Avenida Verde
- 28745 Edenton Way
- 39785 Knollridge Dr
- 27668 Parkside Dr
- 40320 Paseo Del Cielo
- 39885 Rustic Glen Dr
- 39714 Rustic Glen Dr
- 39277 Cayman Ct
- 30041 Los Nogales Rd
- 41480 Luz Del Sol
- 40087 Cannes Ct
- 27297 Sierra Madre Dr
- 40215 Mimulus Way
- 40231 Mimulus Way
- 40207 Mimulus Way
- 40237 Mimulus Way
- 40271 Camino Campos Verde
- 40281 Camino Campos Verde
- 40261 Camino Campos Verde
- 40199 Mimulus Way
- 40250 Mimulus Way
- 27590 Stanford Dr
- 27600 Stanford Dr
- 27580 Stanford Dr
- 27606 Stanford Dr
- 27616 Stanford Dr
- 40251 Camino Campos Verde
- 40191 Mimulus Way
- 27570 Stanford Dr
- 27626 Stanford Dr
- 40251 Mimulus Way
- 27636 Stanford Dr
Your Personal Tour Guide
Ask me questions while you tour the home.