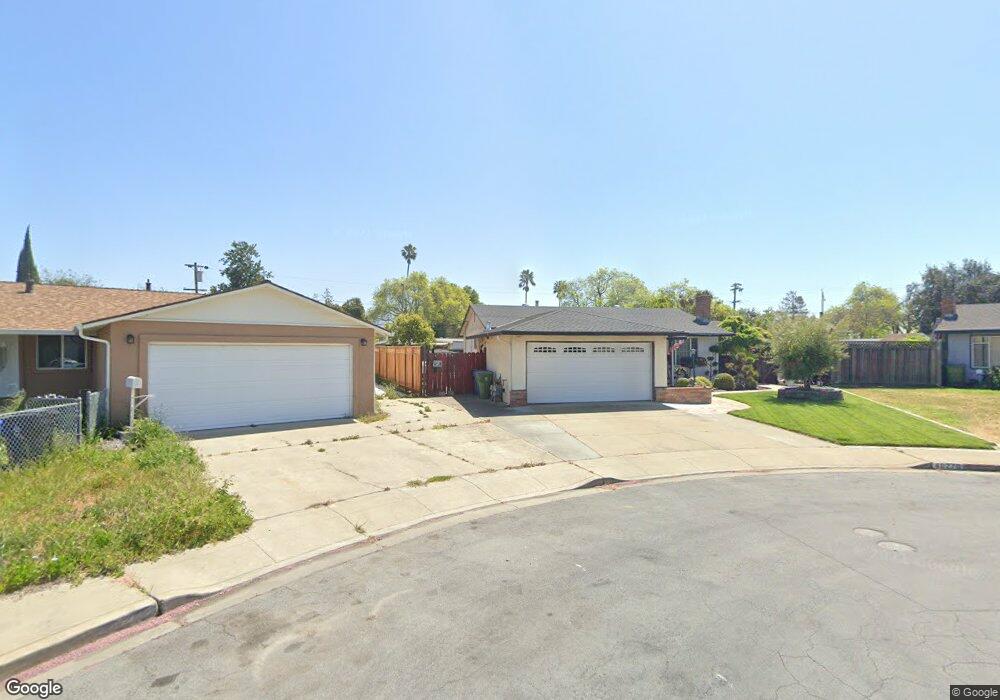
40270 Davis Ct Fremont, CA 94538
Sundale NeighborhoodEstimated Value: $1,277,000 - $1,490,000
3
Beds
2
Baths
1,468
Sq Ft
$959/Sq Ft
Est. Value
About This Home
This home is located at 40270 Davis Ct, Fremont, CA 94538 and is currently estimated at $1,407,592, approximately $958 per square foot. 40270 Davis Ct is a home located in Alameda County with nearby schools including John Blacow Elementary School, G.M. Walters Middle School, and John F. Kennedy High School.
Ownership History
Date
Name
Owned For
Owner Type
Purchase Details
Closed on
Dec 9, 2020
Sold by
Otani Richard Hiroshi
Bought by
Otani Richard Hiroshi and The Richard Hiroshi Otani Livi
Current Estimated Value
Purchase Details
Closed on
Jul 8, 2020
Sold by
Otani Richard Hiroshi
Bought by
Otani Richard Hiroshi and The Richard Hiroshi Otani Livi
Purchase Details
Closed on
Apr 14, 2020
Sold by
Otani Richard H and Diaz Carmen
Bought by
Otani Richard H
Home Financials for this Owner
Home Financials are based on the most recent Mortgage that was taken out on this home.
Original Mortgage
$276,000
Interest Rate
2.9%
Mortgage Type
New Conventional
Purchase Details
Closed on
Jul 30, 2008
Sold by
Otani Richard H
Bought by
Otani Richard H and Diaz Carmen
Purchase Details
Closed on
Jan 27, 1997
Sold by
Otani Richard H and Otani Emilia V
Bought by
Otani Richard H
Home Financials for this Owner
Home Financials are based on the most recent Mortgage that was taken out on this home.
Original Mortgage
$138,600
Interest Rate
9.25%
Create a Home Valuation Report for This Property
The Home Valuation Report is an in-depth analysis detailing your home's value as well as a comparison with similar homes in the area
Home Values in the Area
Average Home Value in this Area
Purchase History
| Date | Buyer | Sale Price | Title Company |
|---|---|---|---|
| Otani Richard Hiroshi | -- | None Available | |
| Otani Richard Hiroshi | -- | None Available | |
| Otani Richard H | $285,000 | None Available | |
| Otani Richard H | -- | Commonwealth Land Title | |
| Otani Richard H | $69,500 | Chicago Title Co |
Source: Public Records
Mortgage History
| Date | Status | Borrower | Loan Amount |
|---|---|---|---|
| Previous Owner | Otani Richard H | $276,000 | |
| Previous Owner | Otani Richard H | $138,600 |
Source: Public Records
Tax History Compared to Growth
Tax History
| Year | Tax Paid | Tax Assessment Tax Assessment Total Assessment is a certain percentage of the fair market value that is determined by local assessors to be the total taxable value of land and additions on the property. | Land | Improvement |
|---|---|---|---|---|
| 2025 | $3,518 | $242,896 | $115,772 | $134,124 |
| 2024 | $3,518 | $237,996 | $113,502 | $131,494 |
| 2023 | $3,406 | $240,193 | $111,277 | $128,916 |
| 2022 | $3,338 | $228,483 | $109,095 | $126,388 |
| 2021 | $3,262 | $223,866 | $106,956 | $123,910 |
| 2020 | $3,195 | $228,499 | $105,859 | $122,640 |
| 2019 | $3,162 | $224,019 | $103,784 | $120,235 |
| 2018 | $3,096 | $219,627 | $101,749 | $117,878 |
| 2017 | $3,018 | $215,322 | $99,755 | $115,567 |
| 2016 | $2,954 | $211,101 | $97,799 | $113,302 |
| 2015 | $2,903 | $207,930 | $96,330 | $111,600 |
| 2014 | $2,844 | $203,857 | $94,443 | $109,414 |
Source: Public Records
Map
Nearby Homes
- 4421 Cahill St
- 4453 Porter St
- 40702 Greystone Terrace Unit 9
- 40116 Crockett St
- 4214 Providence Terrace
- 4555 Stevenson Blvd
- 39993 Fremont Blvd Unit 102
- 4310 Providence Terrace
- 4463 Hyde Common Unit 306
- 3909 Stevenson Blvd Unit 402
- 40708 Fremont Blvd
- 40769 Squill Common
- 3695 Stevenson Blvd Unit E206
- 40696 Robin St
- 4840 Piper St
- 4600 Nelson St
- 40469 Shaw Ct
- 4737 Boone Dr
- 39850 Sundale Dr
- 3583 Madison Common
- 40262 Davis Ct
- 4325 Porter St
- 40269 Davis Ct
- 4317 Porter St
- 4333 Porter St
- 4309 Porter St
- 40261 Davis Ct
- 40254 Davis Ct
- 4341 Porter St
- 40333 Davis St
- 40325 Davis St
- 4301 Porter St
- 40253 Davis Ct
- 4349 Porter St
- 40246 Davis Ct
- 40279 Davis St
- 40338 Vivaldi Rose Common
- 40344 Vivaldi Rose Common
- 40332 Vivaldi Rose Common
- 40245 Davis Ct