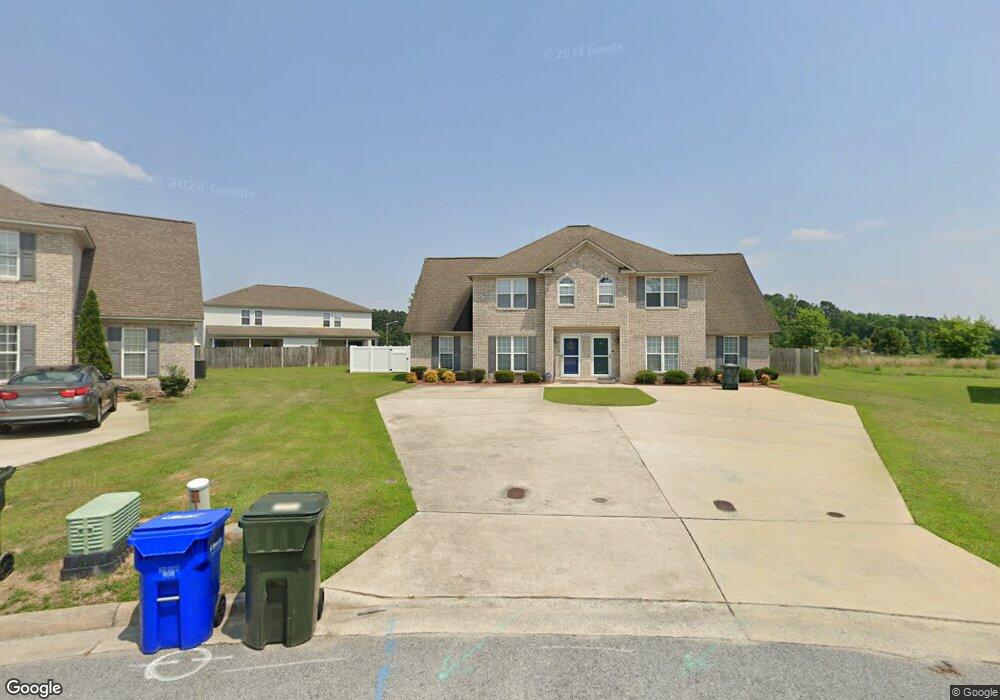
4029 Lucerne Ct Unit A Winterville, NC 28590
Estimated Value: $192,000 - $302,000
3
Beds
4
Baths
1,750
Sq Ft
$133/Sq Ft
Est. Value
About This Home
This home is located at 4029 Lucerne Ct Unit A, Winterville, NC 28590 and is currently estimated at $232,100, approximately $132 per square foot. 4029 Lucerne Ct Unit A is a home located in Pitt County with nearby schools including W.H. Robinson Elementary School, E.B. Aycock Middle School, and South Central High School.
Ownership History
Date
Name
Owned For
Owner Type
Purchase Details
Closed on
Jun 29, 2010
Sold by
Fannie Mae
Bought by
Yard Claude A
Current Estimated Value
Home Financials for this Owner
Home Financials are based on the most recent Mortgage that was taken out on this home.
Original Mortgage
$109,000
Interest Rate
4.61%
Mortgage Type
VA
Purchase Details
Closed on
Feb 14, 2010
Sold by
Simmons Elizabeth B
Bought by
Federal National Mortgage Association
Purchase Details
Closed on
Nov 13, 2006
Sold by
Aldridge And Southerland Builders Inc
Bought by
Simmons Elizabeth Barrett
Home Financials for this Owner
Home Financials are based on the most recent Mortgage that was taken out on this home.
Original Mortgage
$105,920
Interest Rate
6.27%
Mortgage Type
New Conventional
Create a Home Valuation Report for This Property
The Home Valuation Report is an in-depth analysis detailing your home's value as well as a comparison with similar homes in the area
Home Values in the Area
Average Home Value in this Area
Purchase History
| Date | Buyer | Sale Price | Title Company |
|---|---|---|---|
| Yard Claude A | -- | None Available | |
| Federal National Mortgage Association | $119,539 | None Available | |
| Simmons Elizabeth Barrett | $130,000 | None Available |
Source: Public Records
Mortgage History
| Date | Status | Borrower | Loan Amount |
|---|---|---|---|
| Previous Owner | Yard Claude A | $109,000 | |
| Previous Owner | Simmons Elizabeth Barrett | $105,920 |
Source: Public Records
Tax History Compared to Growth
Tax History
| Year | Tax Paid | Tax Assessment Tax Assessment Total Assessment is a certain percentage of the fair market value that is determined by local assessors to be the total taxable value of land and additions on the property. | Land | Improvement |
|---|---|---|---|---|
| 2025 | $2,132 | $206,709 | $25,000 | $181,709 |
| 2024 | $2,120 | $206,709 | $25,000 | $181,709 |
| 2023 | $1,561 | $124,215 | $17,000 | $107,215 |
| 2022 | $1,578 | $124,215 | $17,000 | $107,215 |
| 2021 | $1,561 | $124,215 | $17,000 | $107,215 |
| 2020 | $1,574 | $124,215 | $17,000 | $107,215 |
| 2019 | $1,513 | $115,065 | $17,000 | $98,065 |
| 2018 | $1,470 | $115,065 | $17,000 | $98,065 |
| 2017 | $1,470 | $115,065 | $17,000 | $98,065 |
| 2016 | $1,459 | $115,065 | $17,000 | $98,065 |
| 2015 | $1,518 | $120,570 | $17,000 | $103,570 |
| 2014 | $1,518 | $120,570 | $17,000 | $103,570 |
Source: Public Records
Map
Nearby Homes
- 4029 Lucerne Ct Unit B
- 350 Eliza Way
- 305 S Pointe Dr Unit A
- 628 Cheltenham Dr
- 104 Briarwood Dr
- 3917 Sterling Pointe Dr Unit 1
- 3917 Sterling Pointe Dr Unit Kk10
- 3921 Sterling Pointe Dr Unit Ll5
- 0 Beacon Dr
- 519 Crestline Blvd
- 3902 Kipling Ct
- 3900 Sterling Pointe Dr
- 3900 Sterling Pointe Dr Unit AA4
- 407 Cedarhurst Rd
- 26 Beacon Dr
- 401 Club Pines Dr
- 604 Club Pines Dr
- 3806 Sterling Pointe Dr Unit D3
- 3930 Sterling Pointe Dr Unit Zz2
- 3987 Sterling Pointe Dr Unit Lll2
- 4029 Lucerne Ct
- 4029 Lucerne Ct
- 305 S Square Dr
- 305 S Square Dr
- 305 S Square Dr Unit B
- 4033 Lucerne Ct Unit A&B
- 4033 Lucerne Ct
- 4025 Lucerne Ct
- 4025 Lucerne Ct
- 301B S Square Dr
- 301 S Square Dr
- 301 S Square Dr Unit B
- 309 A S Square Dr
- 309 S Square Dr
- 309 S Square Dr
- 4032B Lucerne Ct
- 4021 Lucerne Ct
- 4021B Lucerne Ct
- 255 S Square Dr
- 255 S Square Dr