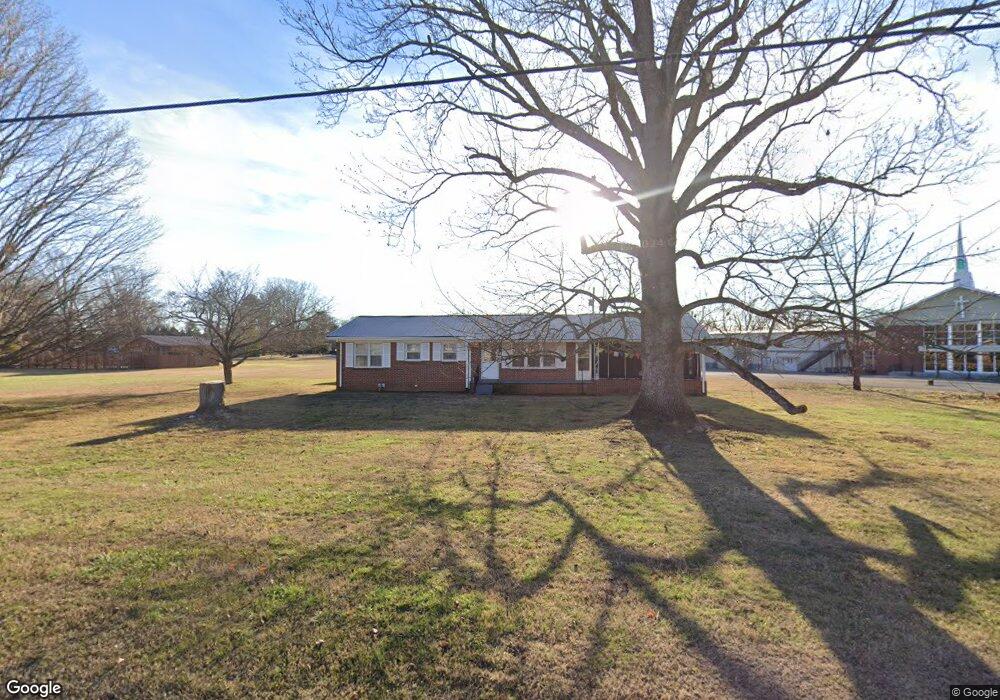
403 4th Ave N Decherd, TN 37324
Estimated Value: $204,899 - $255,000
Studio
2
Baths
1,452
Sq Ft
$162/Sq Ft
Est. Value
About This Home
This home is located at 403 4th Ave N, Decherd, TN 37324 and is currently estimated at $234,975, approximately $161 per square foot. 403 4th Ave N is a home located in Franklin County with nearby schools including North Middle School, Franklin County High School, and School of the Good Shepherd.
Ownership History
Date
Name
Owned For
Owner Type
Purchase Details
Closed on
Nov 15, 2013
Sold by
Goolsby Rebecca Jo
Bought by
Holt Tammy Michelle and Mason Sheila Ann
Current Estimated Value
Home Financials for this Owner
Home Financials are based on the most recent Mortgage that was taken out on this home.
Original Mortgage
$100,000
Outstanding Balance
$74,357
Interest Rate
4.31%
Mortgage Type
Commercial
Estimated Equity
$160,618
Purchase Details
Closed on
Dec 5, 1979
Bought by
Goolsby Rebecca Jo
Purchase Details
Closed on
Apr 1, 1975
Purchase Details
Closed on
Dec 23, 1969
Create a Home Valuation Report for This Property
The Home Valuation Report is an in-depth analysis detailing your home's value as well as a comparison with similar homes in the area
Purchase History
| Date | Buyer | Sale Price | Title Company |
|---|---|---|---|
| Holt Tammy Michelle | $100,000 | -- | |
| Goolsby Rebecca Jo | -- | -- | |
| -- | -- | -- | |
| -- | -- | -- |
Source: Public Records
Mortgage History
| Date | Status | Borrower | Loan Amount |
|---|---|---|---|
| Open | Holt Tammy Michelle | $100,000 |
Source: Public Records
Tax History
| Year | Tax Paid | Tax Assessment Tax Assessment Total Assessment is a certain percentage of the fair market value that is determined by local assessors to be the total taxable value of land and additions on the property. | Land | Improvement |
|---|---|---|---|---|
| 2025 | -- | $47,500 | $7,375 | $40,125 |
| 2024 | -- | $47,500 | $7,375 | $40,125 |
| 2023 | $1,308 | $47,500 | $7,375 | $40,125 |
| 2022 | $1,237 | $47,500 | $7,375 | $40,125 |
| 2021 | $785 | $47,500 | $7,375 | $40,125 |
| 2020 | $1,123 | $27,975 | $5,475 | $22,500 |
| 2019 | $1,123 | $27,975 | $5,475 | $22,500 |
| 2018 | $1,065 | $27,975 | $5,475 | $22,500 |
| 2017 | $1,065 | $27,975 | $5,475 | $22,500 |
| 2016 | $1,019 | $26,775 | $5,475 | $21,300 |
| 2015 | $1,019 | $26,775 | $5,475 | $21,300 |
| 2014 | $1,019 | $26,762 | $0 | $0 |
Source: Public Records
Map
Nearby Homes
- 909 Cumberland St Unit 911
- 203 5th Ave N
- 1001 Henley St
- 1105 Cumberland St Unit 1107
- 501 W Broad St
- 201 10th Ave N
- 106 5th Ave N
- 44 Flint Dr
- 202 W Main St
- 404 Horton St
- 206 Hotel St
- 107 N West St
- 301 Bennett St
- 240 Dogwood Dr
- 205 Mary Sharp Dr
- 105 Lakeview Dr
- 401 E Petty Ln
- 0 Aedc Rd Unit 2
- 210 E Petty Ln
- 67 Edgefield Ct
Your Personal Tour Guide
Ask me questions while you tour the home.