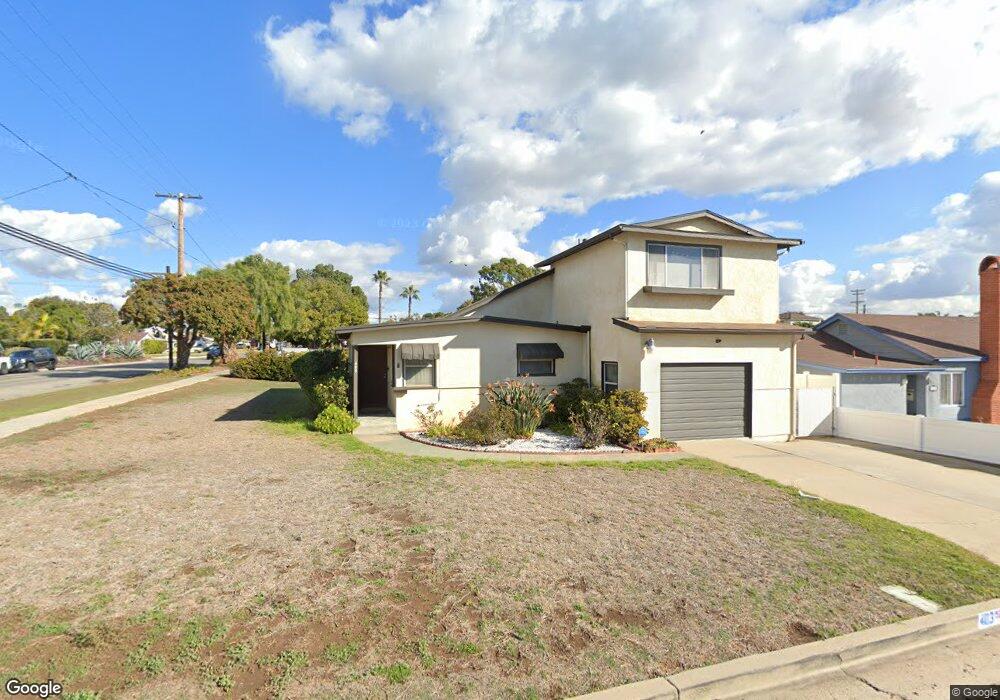
403 Alpine Ave Chula Vista, CA 91910
Hilltop NeighborhoodEstimated Value: $764,000 - $801,148
3
Beds
1
Bath
1,343
Sq Ft
$581/Sq Ft
Est. Value
About This Home
This home is located at 403 Alpine Ave, Chula Vista, CA 91910 and is currently estimated at $780,537, approximately $581 per square foot. 403 Alpine Ave is a home located in San Diego County with nearby schools including Rosebank Elementary School, Hilltop Middle School, and Hilltop Senior High School.
Ownership History
Date
Name
Owned For
Owner Type
Purchase Details
Closed on
Feb 26, 2025
Sold by
Samuel W Milton Living Trust and Murcia Emilia
Bought by
Murcia Emilia
Current Estimated Value
Purchase Details
Closed on
Mar 6, 2006
Sold by
Milton Samuel W
Bought by
Milton Samuel W
Purchase Details
Closed on
Oct 22, 1993
Sold by
Milton Samuel W
Bought by
Milton Samuel W
Home Financials for this Owner
Home Financials are based on the most recent Mortgage that was taken out on this home.
Original Mortgage
$63,100
Interest Rate
6.51%
Create a Home Valuation Report for This Property
The Home Valuation Report is an in-depth analysis detailing your home's value as well as a comparison with similar homes in the area
Home Values in the Area
Average Home Value in this Area
Purchase History
| Date | Buyer | Sale Price | Title Company |
|---|---|---|---|
| Murcia Emilia | -- | None Listed On Document | |
| Milton Samuel W | -- | None Available | |
| Milton Samuel W | -- | Fidelity National Title |
Source: Public Records
Mortgage History
| Date | Status | Borrower | Loan Amount |
|---|---|---|---|
| Previous Owner | Milton Samuel W | $63,100 |
Source: Public Records
Tax History Compared to Growth
Tax History
| Year | Tax Paid | Tax Assessment Tax Assessment Total Assessment is a certain percentage of the fair market value that is determined by local assessors to be the total taxable value of land and additions on the property. | Land | Improvement |
|---|---|---|---|---|
| 2025 | $8,379 | $728,280 | $593,028 | $135,252 |
| 2024 | $8,379 | $714,000 | $581,400 | $132,600 |
| 2023 | $2,212 | $185,268 | $63,536 | $121,732 |
| 2022 | $2,067 | $181,637 | $62,291 | $119,346 |
| 2021 | $2,018 | $178,076 | $61,070 | $117,006 |
| 2020 | $1,970 | $176,251 | $60,444 | $115,807 |
| 2019 | $1,918 | $172,796 | $59,259 | $113,537 |
| 2018 | $1,887 | $169,409 | $58,098 | $111,311 |
| 2017 | $1,846 | $166,088 | $56,959 | $109,129 |
| 2016 | $1,800 | $162,833 | $55,843 | $106,990 |
| 2015 | $1,774 | $160,388 | $55,005 | $105,383 |
| 2014 | $1,744 | $157,247 | $53,928 | $103,319 |
Source: Public Records
Map
Nearby Homes