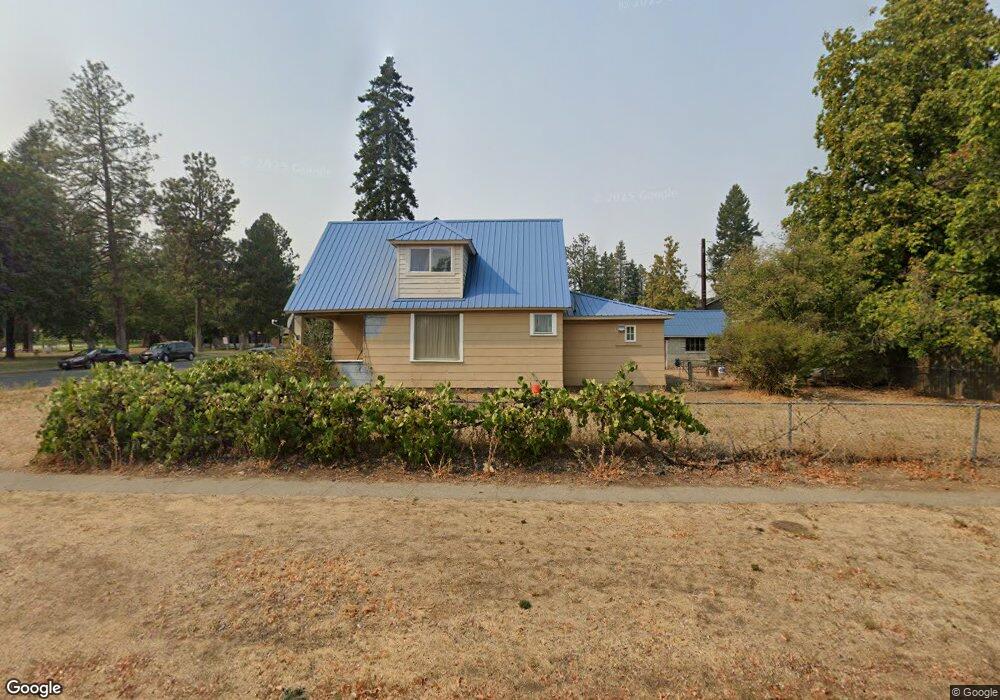
403 C St Cheney, WA 99004
Estimated Value: $249,000 - $282,000
2
Beds
1
Bath
1,312
Sq Ft
$200/Sq Ft
Est. Value
About This Home
This home is located at 403 C St, Cheney, WA 99004 and is currently estimated at $262,625, approximately $200 per square foot. 403 C St is a home located in Spokane County with nearby schools including Betz Elementary School, Cheney Middle School, and Cheney High School.
Ownership History
Date
Name
Owned For
Owner Type
Purchase Details
Closed on
May 17, 2005
Sold by
Canaday Delores A
Bought by
Guske Lowell J and Guske Shelly L
Current Estimated Value
Home Financials for this Owner
Home Financials are based on the most recent Mortgage that was taken out on this home.
Original Mortgage
$66,850
Outstanding Balance
$34,632
Interest Rate
5.74%
Mortgage Type
Purchase Money Mortgage
Estimated Equity
$227,993
Purchase Details
Closed on
May 10, 2005
Sold by
Bank Of America
Bought by
Canaday Deloris
Home Financials for this Owner
Home Financials are based on the most recent Mortgage that was taken out on this home.
Original Mortgage
$66,850
Outstanding Balance
$34,632
Interest Rate
5.74%
Mortgage Type
Purchase Money Mortgage
Estimated Equity
$227,993
Create a Home Valuation Report for This Property
The Home Valuation Report is an in-depth analysis detailing your home's value as well as a comparison with similar homes in the area
Purchase History
| Date | Buyer | Sale Price | Title Company |
|---|---|---|---|
| Guske Lowell J | $95,500 | Pacific Nw Title | |
| Canaday Deloris | -- | First American Title Ins |
Source: Public Records
Mortgage History
| Date | Status | Borrower | Loan Amount |
|---|---|---|---|
| Open | Guske Lowell J | $66,850 |
Source: Public Records
Tax History
| Year | Tax Paid | Tax Assessment Tax Assessment Total Assessment is a certain percentage of the fair market value that is determined by local assessors to be the total taxable value of land and additions on the property. | Land | Improvement |
|---|---|---|---|---|
| 2025 | $2,423 | $227,600 | $75,000 | $152,600 |
| 2024 | $2,423 | $219,400 | $75,000 | $144,400 |
| 2023 | $1,915 | $231,500 | $75,000 | $156,500 |
| 2022 | $1,744 | $228,000 | $75,000 | $153,000 |
| 2021 | $1,702 | $148,400 | $31,500 | $116,900 |
| 2020 | $1,624 | $132,700 | $30,000 | $102,700 |
| 2019 | $1,349 | $116,000 | $28,000 | $88,000 |
| 2018 | $1,491 | $111,700 | $28,000 | $83,700 |
| 2017 | $1,300 | $107,500 | $28,000 | $79,500 |
| 2016 | $1,232 | $98,100 | $28,000 | $70,100 |
| 2015 | $1,192 | $96,600 | $28,000 | $68,600 |
| 2014 | -- | $96,600 | $28,000 | $68,600 |
| 2013 | -- | $0 | $0 | $0 |
Source: Public Records
Map
Nearby Homes
- 910 2nd St
- 317 College Ave
- 422 4th St
- 323 5th St
- 8414 W Sugar Ct
- 1239 1st St
- 1422 4th St
- 5 2nd St
- 624 Union St
- 5339 W Anderson Rd
- 104 W 5th St
- 1626 5th St
- 501 K St Unit 503 K St
- 1717 2nd St
- 1721 5th St
- 716 N 8th St
- 84 Terra Vista St Unit Lot 1
- 84-108 Terra Vista St Unit Lots 1-4, 6 & 7
- 729 Montague Dr
- 318 Plum Tree Ct Unit Lot 10 Block 3 - Sno
Your Personal Tour Guide
Ask me questions while you tour the home.