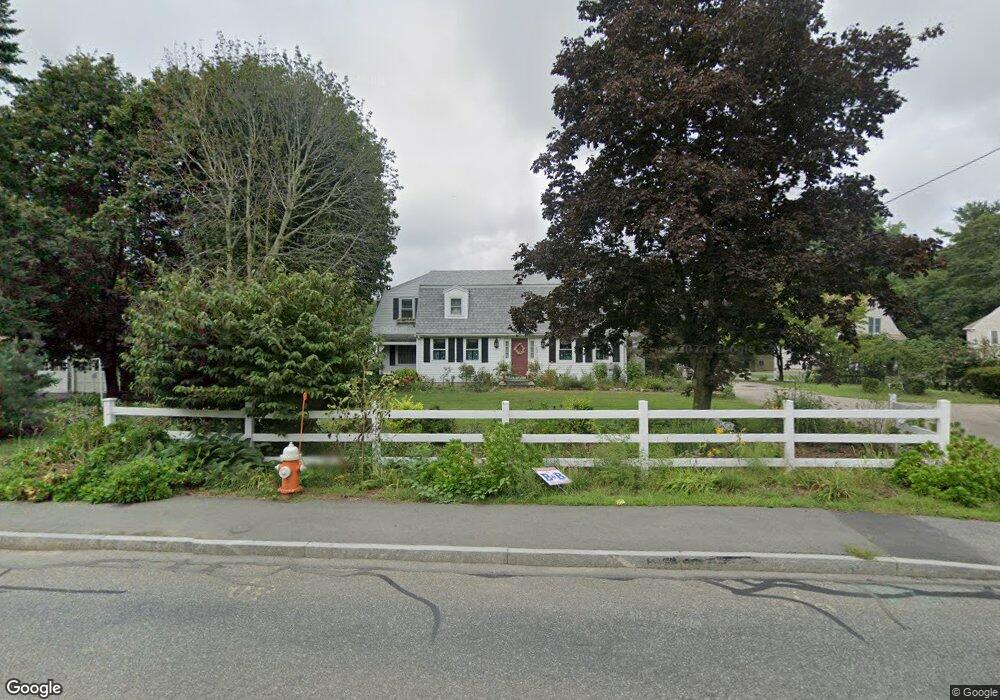
403 Chestnut St Franklin, MA 02038
Estimated Value: $1,095,000 - $1,202,466
4
Beds
4
Baths
5,075
Sq Ft
$227/Sq Ft
Est. Value
About This Home
This home is located at 403 Chestnut St, Franklin, MA 02038 and is currently estimated at $1,152,117, approximately $227 per square foot. 403 Chestnut St is a home located in Norfolk County with nearby schools including Helen Keller Elementary School, Annie Sullivan Middle School, and Franklin High School.
Ownership History
Date
Name
Owned For
Owner Type
Purchase Details
Closed on
Oct 31, 2024
Sold by
Leonard Donald M and Leonard Candida M
Bought by
Leonard Candida M
Current Estimated Value
Purchase Details
Closed on
Jan 16, 2004
Sold by
Rossi Thomas A and Rossi Patricia
Bought by
Leonrad Donald M and Leonard Candida M
Home Financials for this Owner
Home Financials are based on the most recent Mortgage that was taken out on this home.
Original Mortgage
$380,000
Interest Rate
5.98%
Mortgage Type
Purchase Money Mortgage
Create a Home Valuation Report for This Property
The Home Valuation Report is an in-depth analysis detailing your home's value as well as a comparison with similar homes in the area
Purchase History
| Date | Buyer | Sale Price | Title Company |
|---|---|---|---|
| Leonard Candida M | -- | None Available | |
| Leonard Candida M | -- | None Available | |
| Leonrad Donald M | $581,000 | -- | |
| Leonrad Donald M | $581,000 | -- |
Source: Public Records
Mortgage History
| Date | Status | Borrower | Loan Amount |
|---|---|---|---|
| Previous Owner | Leonrad Donald M | $342,000 | |
| Previous Owner | Leonrad Donald M | $380,000 |
Source: Public Records
Tax History
| Year | Tax Paid | Tax Assessment Tax Assessment Total Assessment is a certain percentage of the fair market value that is determined by local assessors to be the total taxable value of land and additions on the property. | Land | Improvement |
|---|---|---|---|---|
| 2025 | $11,847 | $1,019,500 | $281,500 | $738,000 |
| 2024 | $10,228 | $867,500 | $281,500 | $586,000 |
| 2023 | $10,326 | $820,800 | $283,900 | $536,900 |
| 2022 | $9,999 | $711,700 | $234,600 | $477,100 |
| 2021 | $9,426 | $643,400 | $251,300 | $392,100 |
| 2020 | $8,938 | $616,000 | $253,500 | $362,500 |
| 2019 | $8,679 | $592,000 | $229,600 | $362,400 |
| 2018 | $8,282 | $565,300 | $236,200 | $329,100 |
| 2017 | $7,958 | $545,800 | $216,700 | $329,100 |
| 2016 | $7,389 | $509,600 | $214,000 | $295,600 |
| 2015 | $7,485 | $504,400 | $208,800 | $295,600 |
| 2014 | $6,806 | $471,000 | $175,400 | $295,600 |
Source: Public Records
Map
Nearby Homes
- 3 Oak View Terrace Unit 3
- 30 Longobardi Dr Unit 30
- 75 Jordan Rd
- 17 Longhill Rd
- 9 Elliot Mills Unit 5
- 8 Elliot Mills Unit 30
- 5 Elliot Mills Unit 3
- 7 Elliot Mills Unit 4
- 10 Elliot Mills Unit 29
- 14 Waites Crossing
- 204 Lincoln St
- 62 Uncas Ave
- 64 Uncas Ave
- 90 E Central St Unit 103
- 90 E Central St Unit 106
- 90 E Central St Unit 304
- 90 E Central St Unit 202
- 90 E Central St Unit 105
- 90 E Central St Unit 301
- 66 Uncas Ave
Your Personal Tour Guide
Ask me questions while you tour the home.