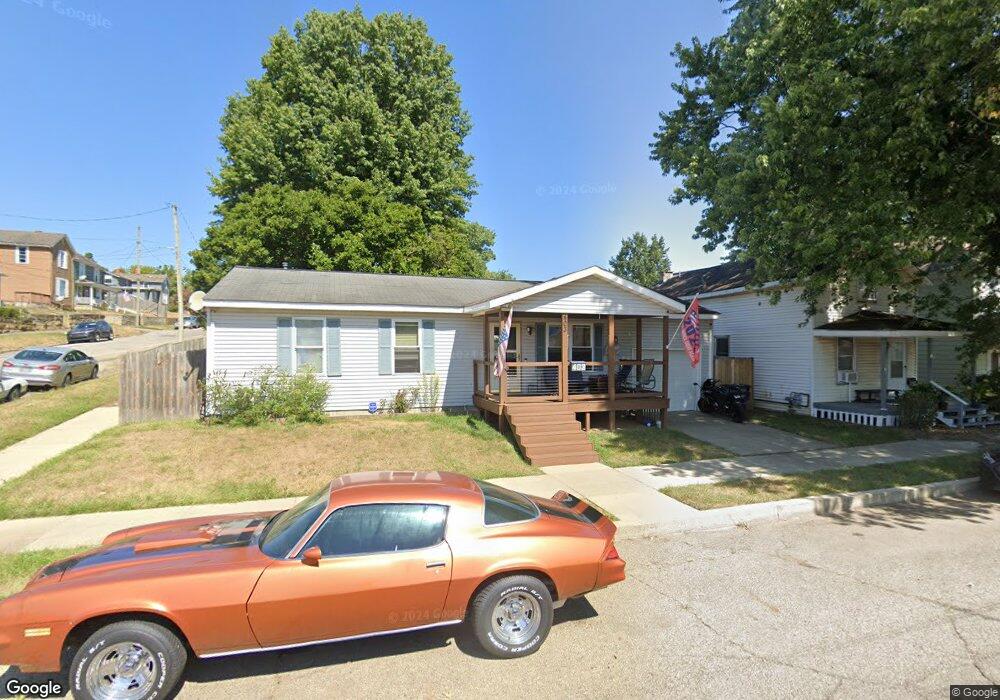
403 E Locust St Lancaster, OH 43130
Estimated Value: $160,000 - $206,000
3
Beds
1
Bath
1,000
Sq Ft
$184/Sq Ft
Est. Value
About This Home
This home is located at 403 E Locust St, Lancaster, OH 43130 and is currently estimated at $184,320, approximately $184 per square foot. 403 E Locust St is a home located in Fairfield County with nearby schools including Thomas Ewing Junior High School, Lancaster High School, and St Mary Elementary School.
Ownership History
Date
Name
Owned For
Owner Type
Purchase Details
Closed on
Apr 10, 2002
Sold by
Short Tina M
Bought by
Stevens Bernard E Cruit Paula A
Current Estimated Value
Home Financials for this Owner
Home Financials are based on the most recent Mortgage that was taken out on this home.
Original Mortgage
$94,000
Outstanding Balance
$37,010
Interest Rate
6.82%
Mortgage Type
New Conventional
Estimated Equity
$147,310
Purchase Details
Closed on
Feb 18, 2000
Sold by
Contimortgage Corp
Bought by
Sanderson Tina M
Home Financials for this Owner
Home Financials are based on the most recent Mortgage that was taken out on this home.
Original Mortgage
$53,650
Interest Rate
8.16%
Mortgage Type
FHA
Purchase Details
Closed on
Jul 7, 1999
Sold by
Shrf Earnest Fox Pr
Bought by
Conti Mortgage Corp
Purchase Details
Closed on
Dec 23, 1994
Sold by
Hahn Erick W
Bought by
Earnest Fox
Purchase Details
Closed on
Oct 23, 1991
Sold by
Stebelton John J
Bought by
Stebelton John J
Purchase Details
Closed on
Sep 1, 1988
Create a Home Valuation Report for This Property
The Home Valuation Report is an in-depth analysis detailing your home's value as well as a comparison with similar homes in the area
Home Values in the Area
Average Home Value in this Area
Purchase History
| Date | Buyer | Sale Price | Title Company |
|---|---|---|---|
| Stevens Bernard E Cruit Paula A | $94,000 | -- | |
| Sanderson Tina M | $18,000 | -- | |
| Conti Mortgage Corp | $28,000 | -- | |
| Earnest Fox | $26,000 | -- | |
| Stebelton John J | -- | -- | |
| -- | $33,900 | -- |
Source: Public Records
Mortgage History
| Date | Status | Borrower | Loan Amount |
|---|---|---|---|
| Open | Stevens Bernard E Cruit Paula A | $94,000 | |
| Previous Owner | Sanderson Tina M | $53,650 |
Source: Public Records
Tax History
| Year | Tax Paid | Tax Assessment Tax Assessment Total Assessment is a certain percentage of the fair market value that is determined by local assessors to be the total taxable value of land and additions on the property. | Land | Improvement |
|---|---|---|---|---|
| 2025 | $4,069 | $63,430 | $10,220 | $53,210 |
| 2024 | $4,069 | $45,260 | $6,920 | $38,340 |
| 2023 | $1,646 | $45,260 | $6,920 | $38,340 |
| 2022 | $1,653 | $45,260 | $6,920 | $38,340 |
| 2021 | $1,456 | $37,350 | $6,920 | $30,430 |
| 2020 | $1,464 | $37,350 | $6,920 | $30,430 |
| 2019 | $1,326 | $37,350 | $6,920 | $30,430 |
| 2018 | $1,292 | $32,930 | $6,920 | $26,010 |
| 2017 | $1,292 | $34,550 | $6,920 | $27,630 |
| 2016 | $1,258 | $34,550 | $6,920 | $27,630 |
| 2015 | $1,250 | $33,300 | $6,920 | $26,380 |
| 2014 | $1,190 | $33,300 | $6,920 | $26,380 |
| 2013 | $1,190 | $33,300 | $6,920 | $26,380 |
Source: Public Records
Map
Nearby Homes
- 414 E Walnut St
- 342 E Chestnut St
- 515 E Chestnut St
- 545 E Main St
- 154 E Main St
- 534 E Wheeling St
- 249 N Pearl Ave
- 547 E Mulberry St
- 621 E Mulberry St
- 0 N Columbus St
- 810 4th St
- 233 Lewis Ave
- 641 King St
- 517 N Maple St
- 846 E Main St
- 844 E Wheeling St
- 600 N High St
- 233 E 6th Ave
- 0 Slocum Ave
- 924 Woodland Ave
- 407 E Locust St
- 409 E Locust St
- 320 Sycamore St
- 413 E Locust St
- 345 E Locust St
- 315 Sycamore St
- 315 Sycamore St Unit 315 & 317
- 402 E Locust St
- 313 Sycamore St
- 313 Sycamore St Unit 313 & 313 1/2
- 313 Sycamore Dr
- 415 E Locust St
- 415 E Locust St
- 408 E Locust St
- 412 E Locust St
- 423 E Locust St
- 309 Sycamore St
- 333 E Locust St
- 0 Locust St
- 427 E Locust St
Your Personal Tour Guide
Ask me questions while you tour the home.