T
Seller's Agent in 2012
Thomas Gaddis
Gaddis REALTORS
(217) 251-2619
7 Total Sales
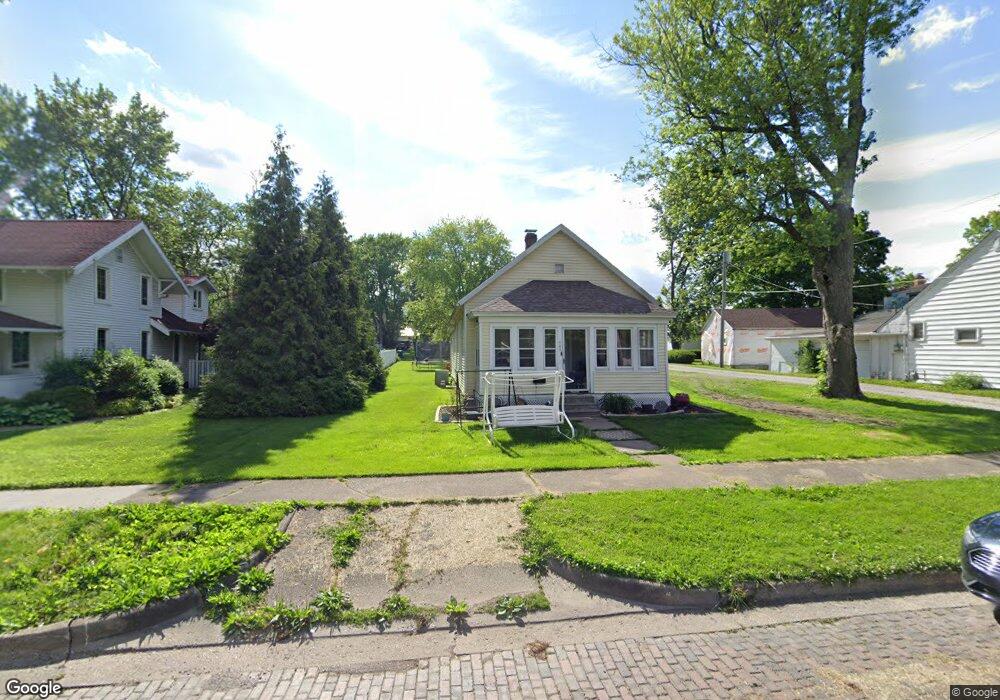

Estimated Value: $72,000 - $82,173
Please allow 5 days for response to offers. All financed purchases must receive free BOA pre-qual in addition to local bank letter. All cash offers must have bank deposit letter. Sold "AS-IS". An inspection is recommended.
Last Agent to Sell the Property
Gaddis REALTORS License #475073084 Listed on: 11/14/2011
| Date | Buyer | Sale Price | Title Company |
|---|---|---|---|
| Jones Erin N | $53,500 | -- | |
| Jones Erin N | $40,000 | Atg | |
| Bac Home Loans Servicing Lp | -- | None Available | |
| Blackwell Wes | -- | None Available |
| Date | Event | Price | List to Sale | Price per Sq Ft |
|---|---|---|---|---|
| 02/24/2012 02/24/12 | Sold | $39,900 | 0.0% | $35 / Sq Ft |
| 01/20/2012 01/20/12 | Pending | -- | -- | -- |
| 11/14/2011 11/14/11 | For Sale | $39,900 | -- | $35 / Sq Ft |
| Year | Tax Paid | Tax Assessment Tax Assessment Total Assessment is a certain percentage of the fair market value that is determined by local assessors to be the total taxable value of land and additions on the property. | Land | Improvement |
|---|---|---|---|---|
| 2024 | $1,028 | $16,578 | $3,775 | $12,803 |
| 2023 | $954 | $15,664 | $3,567 | $12,097 |
| 2022 | $882 | $14,594 | $3,541 | $11,053 |
| 2021 | $851 | $14,308 | $3,472 | $10,836 |
| 2020 | $802 | $13,701 | $3,325 | $10,376 |
| 2019 | $821 | $14,023 | $3,403 | $10,620 |
| 2018 | $877 | $14,598 | $3,327 | $11,271 |
| 2017 | $895 | $14,896 | $3,395 | $11,501 |
| 2016 | $883 | $14,855 | $3,386 | $11,469 |
| 2015 | $875 | $14,682 | $3,346 | $11,336 |
| 2014 | $775 | $13,656 | $3,113 | $10,543 |
| 2013 | $776 | $13,650 | $3,109 | $10,541 |
| 2011 | $2,028 | $20,790 | $3,183 | $17,607 |
T
Seller's Agent in 2012
Thomas Gaddis
Gaddis REALTORS
(217) 251-2619
7 Total Sales

Buyer's Agent in 2012
Twila Bumgardner
Grissom-Schmitz Realty
(217) 827-3189
78 in this area
110 Total Sales
Source: Central Illinois Board of REALTORS®
MLS Number: 4214383
APN: 11-25-22-117-007-00
Ask me questions while you tour the home.