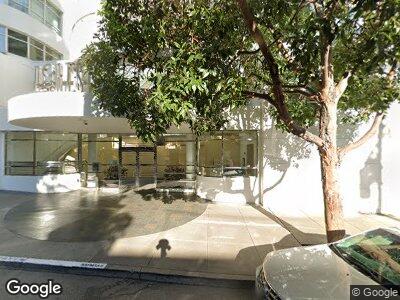
Portside 403 Main St Unit 520N San Francisco, CA 94105
South Beach NeighborhoodEstimated Value: $903,232 - $1,086,000
2
Beds
2
Baths
1,083
Sq Ft
$937/Sq Ft
Est. Value
About This Home
This home is located at 403 Main St Unit 520N, San Francisco, CA 94105 and is currently estimated at $1,015,058, approximately $937 per square foot. 403 Main St Unit 520N is a home located in San Francisco County with nearby schools including Daniel Webster Elementary School, James Lick Middle School, and Five Keys Charter School.
Ownership History
Date
Name
Owned For
Owner Type
Purchase Details
Closed on
Oct 2, 2024
Sold by
Goli Srinivasa R and Mirtipati Surya Kumari
Bought by
Goli & Mirtipati Trust and Goli
Current Estimated Value
Home Financials for this Owner
Home Financials are based on the most recent Mortgage that was taken out on this home.
Original Mortgage
$749,000
Interest Rate
6.86%
Mortgage Type
New Conventional
Purchase Details
Closed on
Aug 8, 2024
Sold by
Brown Ronald B and Qualls Schyleen
Bought by
Goli Rithik S and Goli Srinivasa R
Home Financials for this Owner
Home Financials are based on the most recent Mortgage that was taken out on this home.
Original Mortgage
$749,000
Interest Rate
6.86%
Mortgage Type
New Conventional
Purchase Details
Closed on
Nov 7, 1997
Sold by
Portside Ii Llc
Bought by
Brown Ronald B and Qualls Schyleen
Home Financials for this Owner
Home Financials are based on the most recent Mortgage that was taken out on this home.
Original Mortgage
$389,000
Interest Rate
7.13%
Create a Home Valuation Report for This Property
The Home Valuation Report is an in-depth analysis detailing your home's value as well as a comparison with similar homes in the area
Home Values in the Area
Average Home Value in this Area
Purchase History
| Date | Buyer | Sale Price | Title Company |
|---|---|---|---|
| Goli & Mirtipati Trust | -- | None Listed On Document | |
| Goli Rithik S | -- | Old Republic Title | |
| Brown Ronald B | $486,500 | Old Republic Title Company |
Source: Public Records
Mortgage History
| Date | Status | Borrower | Loan Amount |
|---|---|---|---|
| Previous Owner | Goli Rithik S | $749,000 | |
| Previous Owner | Brown Ronald B | $389,000 |
Source: Public Records
Tax History Compared to Growth
Tax History
| Year | Tax Paid | Tax Assessment Tax Assessment Total Assessment is a certain percentage of the fair market value that is determined by local assessors to be the total taxable value of land and additions on the property. | Land | Improvement |
|---|---|---|---|---|
| 2024 | $9,153 | $761,238 | $469,628 | $291,610 |
| 2023 | $9,022 | $746,313 | $460,420 | $285,893 |
| 2022 | $8,861 | $731,681 | $451,393 | $280,288 |
| 2021 | $8,708 | $717,336 | $442,543 | $274,793 |
| 2020 | $8,732 | $709,982 | $438,006 | $271,976 |
| 2019 | $8,434 | $696,062 | $429,418 | $266,644 |
| 2018 | $8,153 | $682,415 | $420,999 | $261,416 |
| 2017 | $8,067 | $669,036 | $412,745 | $256,291 |
| 2016 | $7,925 | $655,918 | $404,652 | $251,266 |
| 2015 | $7,833 | $646,066 | $398,574 | $247,492 |
| 2014 | $7,776 | $633,411 | $390,767 | $242,644 |
Source: Public Records
About Portside
Map
Nearby Homes
- 403 Main St Unit 703N
- 403 Main St Unit 219N
- 101 Harrison St Unit 102
- 101 Harrison St Unit 121
- 201 Harrison St Unit 429
- 38 Bryant St Unit 605
- 400 Spear St Unit 104
- 400 Spear St Unit 109
- 333 Main St Unit 2A
- 333 Main St Unit 7B
- 333 Main St Unit 5E
- 400 Beale St Unit 1007
- 400 Beale St Unit 2202
- 400 Beale St Unit 1207
- 338 Main St Unit 7H
- 338 Main St Unit 10D
- 338 Main St Unit 27A
- 338 Main St Unit 35E
- 338 Spear St Unit 16E
- 338 Spear St Unit 35E