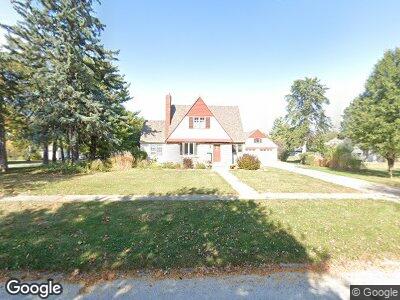
403 NE Elm St Greenfield, IA 50849
Estimated Value: $191,000 - $225,199
2
Beds
4
Baths
1,904
Sq Ft
$112/Sq Ft
Est. Value
About This Home
This home is located at 403 NE Elm St, Greenfield, IA 50849 and is currently estimated at $213,050, approximately $111 per square foot. 403 NE Elm St is a home located in Adair County with nearby schools including Nodaway Valley Elementary School, Nodaway Valley Middle School, and Nodaway Valley High School.
Ownership History
Date
Name
Owned For
Owner Type
Purchase Details
Closed on
Oct 23, 2019
Sold by
Yount William G
Bought by
Allsup Diane
Current Estimated Value
Home Financials for this Owner
Home Financials are based on the most recent Mortgage that was taken out on this home.
Original Mortgage
$131,100
Outstanding Balance
$118,134
Interest Rate
3.65%
Mortgage Type
Stand Alone Refi Refinance Of Original Loan
Purchase Details
Closed on
Jun 20, 2006
Sold by
Emerson Karen K
Bought by
Yount William G
Home Financials for this Owner
Home Financials are based on the most recent Mortgage that was taken out on this home.
Original Mortgage
$110,000
Interest Rate
6.72%
Mortgage Type
New Conventional
Create a Home Valuation Report for This Property
The Home Valuation Report is an in-depth analysis detailing your home's value as well as a comparison with similar homes in the area
Home Values in the Area
Average Home Value in this Area
Purchase History
| Date | Buyer | Sale Price | Title Company |
|---|---|---|---|
| Allsup Diane | $138,000 | -- | |
| Yount William G | $157,000 | None Available |
Source: Public Records
Mortgage History
| Date | Status | Borrower | Loan Amount |
|---|---|---|---|
| Open | Allsup Diane | $131,100 | |
| Previous Owner | Yount William | $15,000 | |
| Previous Owner | Yount William | $30,000 | |
| Previous Owner | Yount William G | $103,890 | |
| Previous Owner | Yount William G | $110,000 |
Source: Public Records
Tax History Compared to Growth
Tax History
| Year | Tax Paid | Tax Assessment Tax Assessment Total Assessment is a certain percentage of the fair market value that is determined by local assessors to be the total taxable value of land and additions on the property. | Land | Improvement |
|---|---|---|---|---|
| 2024 | $3,622 | $205,600 | $26,400 | $179,200 |
| 2023 | $3,390 | $205,600 | $26,400 | $179,200 |
| 2022 | $3,194 | $160,060 | $22,180 | $137,880 |
| 2021 | $3,194 | $160,060 | $22,180 | $137,880 |
| 2020 | $3,042 | $149,370 | $22,180 | $127,190 |
| 2019 | $3,412 | $149,370 | $0 | $0 |
| 2018 | $3,284 | $161,474 | $0 | $0 |
| 2017 | $3,284 | $155,464 | $0 | $0 |
| 2016 | $3,170 | $155,464 | $17,397 | $138,067 |
| 2015 | $3,170 | $135,036 | $0 | $0 |
| 2014 | $2,536 | $135,036 | $0 | $0 |
Source: Public Records
Map
Nearby Homes