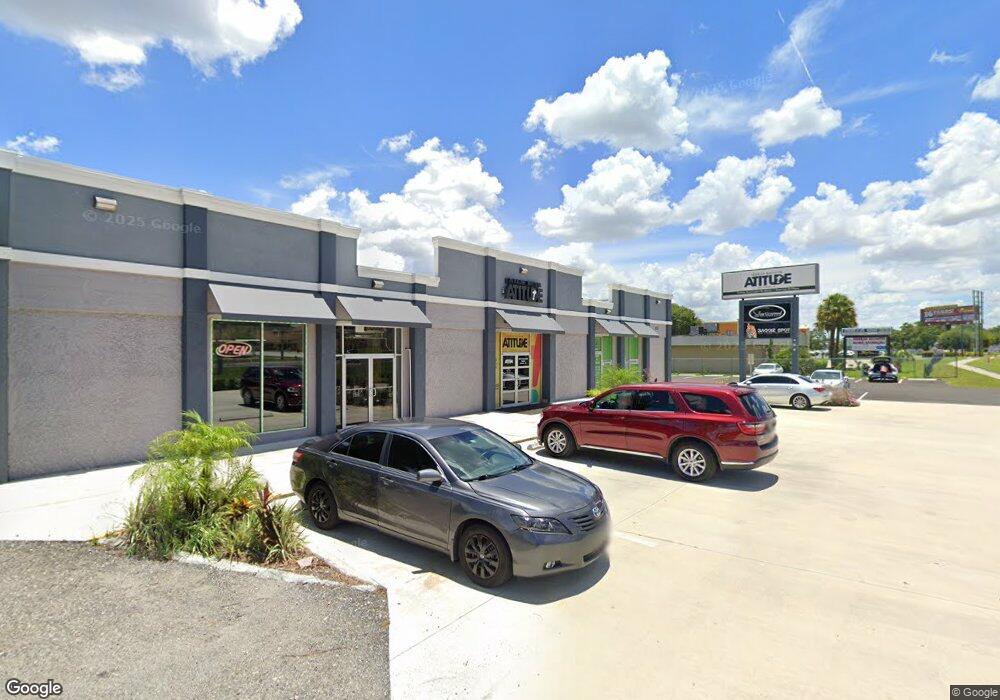
403 S Kirkman Rd Orlando, FL 32811
MetroWest NeighborhoodEstimated Value: $3,361,347
--
Bed
--
Bath
13,192
Sq Ft
$255/Sq Ft
Est. Value
About This Home
This home is located at 403 S Kirkman Rd, Orlando, FL 32811 and is currently estimated at $3,361,347, approximately $254 per square foot. 403 S Kirkman Rd is a home located in Orange County with nearby schools including Orlo Vista Elementary, Carver Middle School, and Jones High School.
Ownership History
Date
Name
Owned For
Owner Type
Purchase Details
Closed on
Jun 25, 2021
Sold by
Kirkman 403 Llc
Bought by
Ronadiad1313 Llc
Current Estimated Value
Home Financials for this Owner
Home Financials are based on the most recent Mortgage that was taken out on this home.
Original Mortgage
$1,100,000
Outstanding Balance
$998,079
Interest Rate
2.9%
Mortgage Type
New Conventional
Estimated Equity
$2,363,268
Purchase Details
Closed on
Sep 20, 2018
Sold by
Dennison Jay C and Dennison Kimberly
Bought by
Kirkman 403 Llc
Home Financials for this Owner
Home Financials are based on the most recent Mortgage that was taken out on this home.
Original Mortgage
$800,000
Interest Rate
4.5%
Mortgage Type
Future Advance Clause Open End Mortgage
Purchase Details
Closed on
Feb 17, 2003
Sold by
Dennison Jay C
Bought by
Dennison Jay C and Dennison Janet Kimberly
Purchase Details
Closed on
Dec 9, 2002
Sold by
Dennison Patricia A
Bought by
Dennison Jay C
Purchase Details
Closed on
Feb 16, 1996
Sold by
Dennison Jimmy C and Dennison Elisa
Bought by
Dennison Jay C and Dennison Patricia A
Create a Home Valuation Report for This Property
The Home Valuation Report is an in-depth analysis detailing your home's value as well as a comparison with similar homes in the area
Home Values in the Area
Average Home Value in this Area
Purchase History
| Date | Buyer | Sale Price | Title Company |
|---|---|---|---|
| Ronadiad1313 Llc | $2,500,000 | None Listed On Document | |
| Kirkman 403 Llc | $1,250,000 | None Available | |
| Dennison Jay C | $297,500 | -- | |
| Dennison Jay C | -- | -- | |
| Dennison Jay C | $520,000 | -- |
Source: Public Records
Mortgage History
| Date | Status | Borrower | Loan Amount |
|---|---|---|---|
| Open | Ronadiad1313 Llc | $1,100,000 | |
| Previous Owner | Kirkman 403 Llc | $800,000 |
Source: Public Records
Tax History Compared to Growth
Tax History
| Year | Tax Paid | Tax Assessment Tax Assessment Total Assessment is a certain percentage of the fair market value that is determined by local assessors to be the total taxable value of land and additions on the property. | Land | Improvement |
|---|---|---|---|---|
| 2025 | $32,433 | $2,111,831 | $366,439 | $1,745,392 |
| 2024 | $31,127 | $2,008,033 | $348,990 | $1,659,043 |
| 2023 | $31,127 | $2,007,107 | $348,987 | $1,658,120 |
| 2022 | $30,247 | $1,945,203 | $332,534 | $1,612,669 |
| 2021 | $16,369 | $1,032,638 | $302,225 | $730,413 |
| 2020 | $15,585 | $1,015,765 | $302,225 | $713,540 |
| 2019 | $17,056 | $1,049,858 | $296,163 | $753,695 |
| 2018 | $9,505 | $582,372 | $281,874 | $300,498 |
| 2017 | $8,684 | $521,963 | $256,328 | $265,635 |
| 2016 | $8,793 | $517,255 | $248,967 | $268,288 |
| 2015 | $8,681 | $498,005 | $248,967 | $249,038 |
| 2014 | $8,437 | $476,230 | $248,967 | $227,263 |
Source: Public Records
Map
Nearby Homes
- 410 S Hudson St
- 402 S Hudson St
- 5910 Old Winter Garden Rd
- 25 S Mckinley Ave
- 5525 W Central Blvd
- 5436 Wood Crossing St
- 5248 Yaupon St
- 5435 Roman Ln Unit 50
- 310 Parrish Ave
- 6017 Westgate Dr Unit 924
- 624 Cassine Dr
- 5953 Westgate Dr Unit 1823
- 5956 Westgate Dr Unit 203
- 5968 Westgate Dr Unit 101
- 6052 Westgate Dr Unit 102
- 6040 Westgate Dr Unit 202
- 6070 Westgate Dr Unit 204
- 6059 Westgate Dr Unit 433
- 6071 Westgate Dr Unit 321
- 244 N Hastings St
- 475 S Kirkman Rd
- 312 S Kirkman Rd Unit 312
- 485 S Kirkman Rd Unit 1
- 485 S Kirkman Rd Unit 202
- 485 S Kirkman Rd
- 0 Old Winter Garden Rd Unit O5728833
- 0 Old Winter Garden Rd Unit O5420059
- 0 Old Winter Garden Rd Unit 1 O5129799
- 0 Old Winter Garden Rd Unit O5773092
- 5607 Old Winter Garden Rd
- 5810 Old Winter Garden Rd
- 464 S Kirkman Rd
- 103 S Van Buren Ave
- 5820 Old Winter Garden Rd
- 126 S Hastings St
- 104 S Kirkman Rd
- 104 S Tyler Ave
- 105 S Tyler Ave
- 118 S Hastings St
- 23 S Mckinley Ave