Estimated Value: $147,000 - $225,000
3
Beds
1
Bath
1,254
Sq Ft
$152/Sq Ft
Est. Value
About This Home
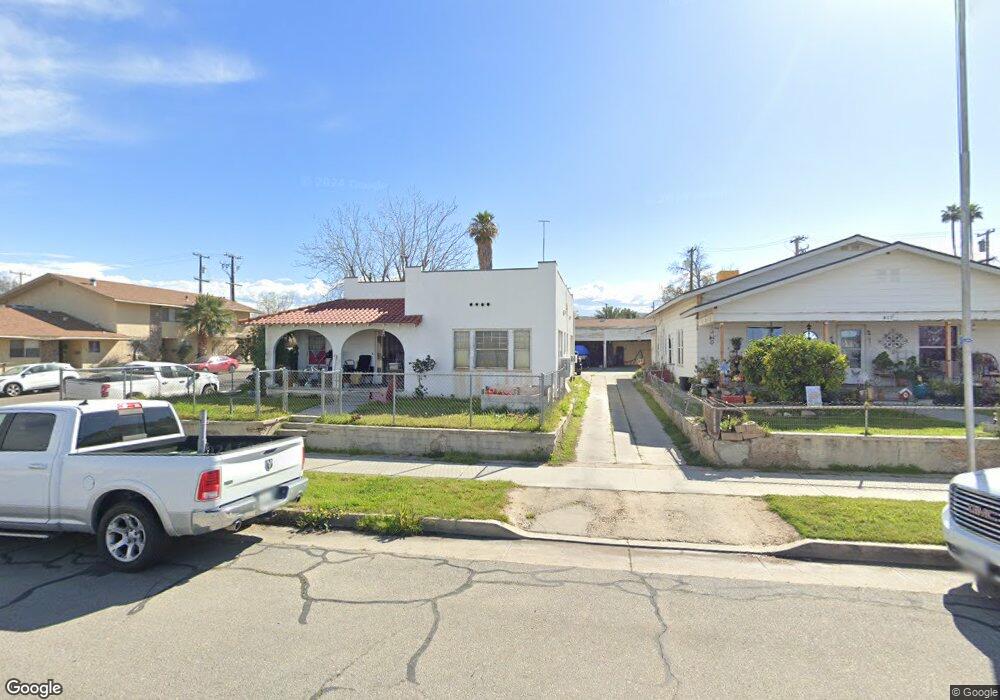
This home is located at 403 Warren St, Taft, CA 93268 and is currently estimated at $190,391, approximately $151 per square foot. 403 Warren St is a home located in Kern County with nearby schools including Roosevelt Elementary School, Taft Primary School, and Lincoln Junior High School.
Ownership History
Date
Name
Owned For
Owner Type
Purchase Details
Closed on
May 16, 2008
Sold by
Leiter Arthur
Bought by
Leiter Carol L
Current Estimated Value
Home Financials for this Owner
Home Financials are based on the most recent Mortgage that was taken out on this home.
Original Mortgage
$58,500
Outstanding Balance
$37,048
Interest Rate
5.88%
Mortgage Type
New Conventional
Estimated Equity
$153,343
Purchase Details
Closed on
May 14, 2008
Sold by
Walls Jessie F
Bought by
Leiter Carol L
Home Financials for this Owner
Home Financials are based on the most recent Mortgage that was taken out on this home.
Original Mortgage
$58,500
Outstanding Balance
$37,048
Interest Rate
5.88%
Mortgage Type
New Conventional
Estimated Equity
$153,343
Purchase Details
Closed on
Jan 10, 1994
Sold by
Walls Jessie F and Standridge Ray D
Bought by
Walls Jessie F
Home Financials for this Owner
Home Financials are based on the most recent Mortgage that was taken out on this home.
Original Mortgage
$41,500
Interest Rate
7.21%
Create a Home Valuation Report for This Property
The Home Valuation Report is an in-depth analysis detailing your home's value as well as a comparison with similar homes in the area
Home Values in the Area
Average Home Value in this Area
Purchase History
| Date | Buyer | Sale Price | Title Company |
|---|---|---|---|
| Leiter Carol L | -- | Chicago Title Company | |
| Leiter Carol L | $65,000 | Chicago Title Company | |
| Walls Jessie F | -- | Commonwealth Land Title Ins |
Source: Public Records
Mortgage History
| Date | Status | Borrower | Loan Amount |
|---|---|---|---|
| Open | Leiter Carol L | $58,500 | |
| Previous Owner | Walls Jessie F | $41,500 |
Source: Public Records
Tax History
| Year | Tax Paid | Tax Assessment Tax Assessment Total Assessment is a certain percentage of the fair market value that is determined by local assessors to be the total taxable value of land and additions on the property. | Land | Improvement |
|---|---|---|---|---|
| 2025 | $1,579 | $30,693 | $6,602 | $24,091 |
| 2024 | $1,429 | $30,092 | $6,473 | $23,619 |
| 2023 | $1,429 | $29,503 | $6,347 | $23,156 |
| 2022 | $1,303 | $28,925 | $6,223 | $22,702 |
| 2021 | $1,156 | $28,358 | $6,101 | $22,257 |
| 2020 | $980 | $28,068 | $6,039 | $22,029 |
| 2019 | $974 | $28,068 | $6,039 | $22,029 |
| 2018 | $967 | $26,980 | $5,805 | $21,175 |
| 2017 | $956 | $26,452 | $5,692 | $20,760 |
| 2016 | $933 | $25,934 | $5,581 | $20,353 |
| 2015 | $870 | $25,546 | $5,498 | $20,048 |
| 2014 | $814 | $25,047 | $5,391 | $19,656 |
Source: Public Records
Map
Nearby Homes
Your Personal Tour Guide
Ask me questions while you tour the home.