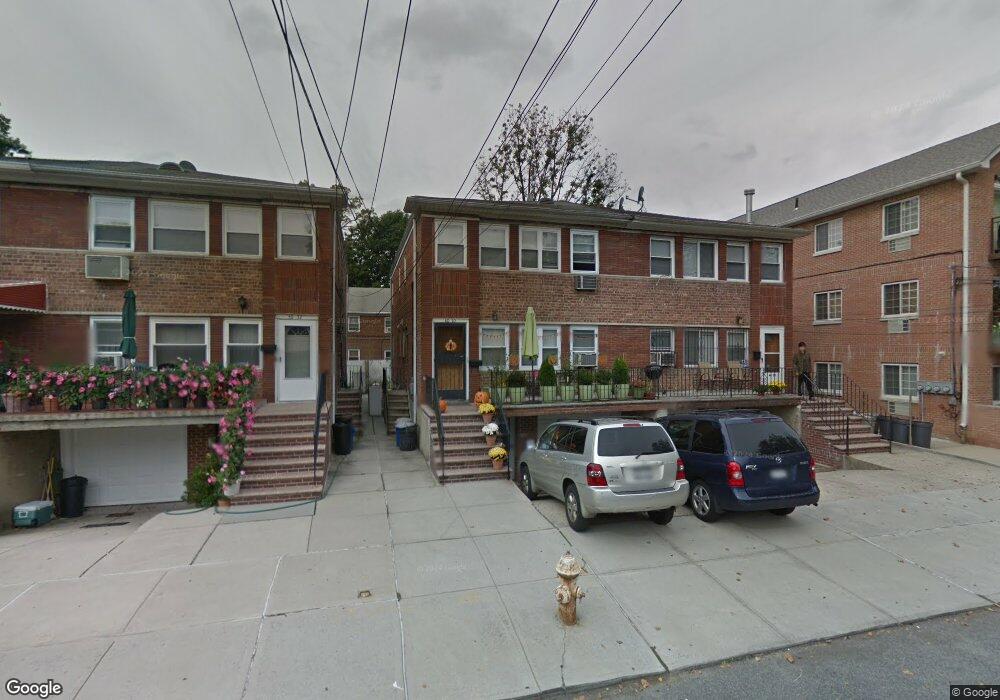
4030 193rd St Unit 2Fl Flushing, NY 11358
Auburndale NeighborhoodEstimated Value: $1,251,000 - $1,469,000
2
Beds
2
Baths
1,890
Sq Ft
$715/Sq Ft
Est. Value
About This Home
This home is located at 4030 193rd St Unit 2Fl, Flushing, NY 11358 and is currently estimated at $1,351,667, approximately $715 per square foot. 4030 193rd St Unit 2Fl is a home located in Queens County with nearby schools including P.S. 31 - Bayside, I.S. 25 Adrien Block, and Francis Lewis High School.
Ownership History
Date
Name
Owned For
Owner Type
Purchase Details
Closed on
May 2, 2017
Sold by
Dai Ren Ai and Wang Jin Dong
Bought by
Mai Xiaoting and Wong Sean
Current Estimated Value
Home Financials for this Owner
Home Financials are based on the most recent Mortgage that was taken out on this home.
Original Mortgage
$750,000
Outstanding Balance
$621,421
Interest Rate
4.14%
Mortgage Type
Purchase Money Mortgage
Estimated Equity
$730,246
Purchase Details
Closed on
Jun 21, 2002
Sold by
Loucas Joan and Bezas Louis
Bought by
Wang Jin Dong and Dai Ren Ai
Home Financials for this Owner
Home Financials are based on the most recent Mortgage that was taken out on this home.
Original Mortgage
$250,000
Interest Rate
6.64%
Mortgage Type
Purchase Money Mortgage
Purchase Details
Closed on
Dec 16, 2000
Sold by
Loucas Joan
Bought by
Loucas Joan and Bezas Maria
Create a Home Valuation Report for This Property
The Home Valuation Report is an in-depth analysis detailing your home's value as well as a comparison with similar homes in the area
Home Values in the Area
Average Home Value in this Area
Purchase History
| Date | Buyer | Sale Price | Title Company |
|---|---|---|---|
| Mai Xiaoting | $1,130,000 | -- | |
| Mai Xiaoting | $1,130,000 | -- | |
| Mai Xiaoting | $1,130,000 | -- | |
| Wang Jin Dong | -- | -- | |
| Wang Jin Dong | -- | -- | |
| Loucas Joan | -- | Fidelity National Title Ins | |
| Loucas Joan | -- | Fidelity National Title Ins |
Source: Public Records
Mortgage History
| Date | Status | Borrower | Loan Amount |
|---|---|---|---|
| Open | Mai Xiaoting | $750,000 | |
| Closed | Mai Xiaoting | $750,000 | |
| Previous Owner | Wang Jin Dong | $250,000 |
Source: Public Records
Tax History Compared to Growth
Tax History
| Year | Tax Paid | Tax Assessment Tax Assessment Total Assessment is a certain percentage of the fair market value that is determined by local assessors to be the total taxable value of land and additions on the property. | Land | Improvement |
|---|---|---|---|---|
| 2025 | $9,747 | $51,439 | $15,253 | $36,186 |
| 2024 | $9,747 | $48,528 | $17,237 | $31,291 |
| 2023 | $9,196 | $45,785 | $13,881 | $31,904 |
| 2022 | $9,298 | $67,560 | $19,500 | $48,060 |
| 2021 | $9,140 | $66,900 | $19,500 | $47,400 |
| 2020 | $9,073 | $73,500 | $19,500 | $54,000 |
| 2019 | $8,460 | $72,660 | $19,500 | $53,160 |
| 2018 | $7,778 | $38,154 | $11,111 | $27,043 |
| 2017 | $7,778 | $38,154 | $15,140 | $23,014 |
| 2016 | $7,570 | $38,154 | $15,140 | $23,014 |
| 2015 | $4,121 | $35,722 | $14,822 | $20,900 |
| 2014 | $4,121 | $33,700 | $16,529 | $17,171 |
Source: Public Records
Map
Nearby Homes
- 40-38 194th St Unit A-1
- 4048 194th St Unit A3
- 190-17 42nd Ave
- 19112 Station Rd
- 191-08 Station Rd
- 4014 191st St
- 191-22 39th Ave
- 194-23 Station Rd
- 191-9 39th Ave Unit 164
- 191-09 39th Ave Unit Lower
- 42-25 189th St
- 190-05 39th Ave Unit 140
- 190-05 39th Ave Unit 142
- 42-32 196th St
- 189-23 39th Ave Unit 122
- 188-02 Northern Blvd
- 196-19 42nd Rd
- 36-20 190th St
- 195-31 39th Ave
- 4320 196th St
- 4030 193rd St Unit 1Fl+Ba
- 4030 193rd St
- 4030 193rd St
- 40-28 193rd St Unit 2Fl
- 4028 193rd St
- 4032 193rd St
- 40-34 193rd St Unit 2
- 40-34 193rd St Unit 1
- 4034 193rd St
- 4026 193rd St
- 4024 193rd St
- 40-29 192nd St Unit F01
- 40-29 192nd St Unit 2
- 4038 193rd St
- 4025 192nd St Unit 3
- 4018 193rd St
- 40-31 192nd St Unit G03
- 4042 193rd St
- 4027 193rd St
- 4017 192nd St Unit 4