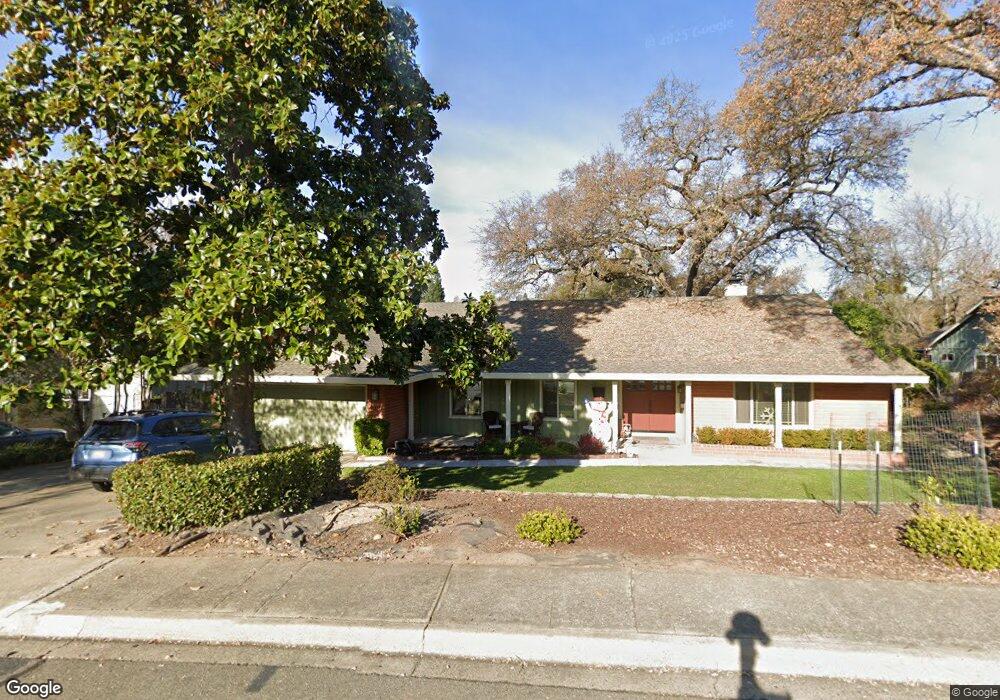
4030 Clover Valley Rd Rocklin, CA 95677
Clover Valley Woods NeighborhoodEstimated Value: $745,000 - $835,707
3
Beds
2
Baths
2,537
Sq Ft
$308/Sq Ft
Est. Value
About This Home
This home is located at 4030 Clover Valley Rd, Rocklin, CA 95677 and is currently estimated at $781,427, approximately $308 per square foot. 4030 Clover Valley Rd is a home located in Placer County with nearby schools including Parker Whitney Elementary School, Spring View Middle School, and Rocklin High.
Ownership History
Date
Name
Owned For
Owner Type
Purchase Details
Closed on
Apr 17, 2014
Sold by
Dour Jane
Bought by
Dour Michael and Dour Brandi
Current Estimated Value
Home Financials for this Owner
Home Financials are based on the most recent Mortgage that was taken out on this home.
Original Mortgage
$330,200
Outstanding Balance
$250,825
Interest Rate
4.32%
Mortgage Type
New Conventional
Estimated Equity
$530,602
Purchase Details
Closed on
Apr 6, 2012
Sold by
Dour Jane
Bought by
Dour Jane
Purchase Details
Closed on
Sep 14, 2011
Sold by
Monsen Susan Ann
Bought by
Dour Jane
Home Financials for this Owner
Home Financials are based on the most recent Mortgage that was taken out on this home.
Original Mortgage
$330,000
Interest Rate
4.37%
Mortgage Type
Purchase Money Mortgage
Purchase Details
Closed on
Jun 17, 2002
Sold by
Monsen Wesley C and Monsen Mary Beth
Bought by
Monsen Wesley C and Monsen Mary E
Purchase Details
Closed on
Aug 2, 1999
Sold by
Mahon Thomas R and Mahon Melennie
Bought by
Monsen Wesley C and Monsen Mary Beth
Create a Home Valuation Report for This Property
The Home Valuation Report is an in-depth analysis detailing your home's value as well as a comparison with similar homes in the area
Home Values in the Area
Average Home Value in this Area
Purchase History
| Date | Buyer | Sale Price | Title Company |
|---|---|---|---|
| Dour Michael | $413,000 | Fidelity National Title Co | |
| Dour Jane | -- | None Available | |
| Dour Jane | $440,000 | Placer Title Company | |
| Monsen Wesley C | -- | -- | |
| Monsen Wesley C | $270,000 | First American Title Ins Co |
Source: Public Records
Mortgage History
| Date | Status | Borrower | Loan Amount |
|---|---|---|---|
| Open | Dour Michael | $330,200 | |
| Previous Owner | Dour Jane | $330,000 |
Source: Public Records
Tax History Compared to Growth
Tax History
| Year | Tax Paid | Tax Assessment Tax Assessment Total Assessment is a certain percentage of the fair market value that is determined by local assessors to be the total taxable value of land and additions on the property. | Land | Improvement |
|---|---|---|---|---|
| 2025 | $5,956 | $552,653 | $100,478 | $452,175 |
| 2023 | $5,956 | $531,194 | $96,577 | $434,617 |
| 2022 | $5,762 | $520,780 | $94,684 | $426,096 |
| 2021 | $5,699 | $510,570 | $92,828 | $417,742 |
| 2020 | $5,690 | $505,336 | $91,877 | $413,459 |
| 2019 | $5,612 | $495,428 | $90,076 | $405,352 |
| 2018 | $5,466 | $485,714 | $88,310 | $397,404 |
| 2017 | $5,471 | $476,191 | $86,579 | $389,612 |
| 2016 | $5,315 | $466,855 | $84,882 | $381,973 |
| 2015 | $5,249 | $459,843 | $83,607 | $376,236 |
| 2014 | $5,235 | $450,837 | $81,970 | $368,867 |
Source: Public Records
Map
Nearby Homes
- 3425 Cimmeron Ct
- 3563 Creekwood Dr
- 0 Skyline Dr Unit 225004715
- 3962 Rawhide Rd
- 5247 Silver Peak Ln
- 3120 Aaron Dr
- 4050 Whitney Vista Ln
- 4057 Whitney Vista Ln
- 4270 Midas Ave
- 3203 Thistle Ct
- 4072 Whitney Vista Ln
- 3710 Clover Valley Rd
- 3993 Aitken Dairy Rd
- 4346 Lakebreeze Dr
- 3724 Sweetwater Dr
- 3415 Oakcreek Dr
- 3420 Nathan Ct
- 3265 Argonaut Ave
- 4245 Americana Way
- 4150 Tahoe Vista Dr
- 4020 Clover Valley Rd
- 4040 Clover Valley Rd
- 4010 Clover Valley Rd
- 4050 Clover Valley Rd
- 4025 Clover Valley Rd
- 4045 Clover Valley Rd
- 4000 Clover Valley Rd
- 3429 Cimmeron Ct
- 4060 Clover Valley Rd
- 4055 Clover Valley Rd
- 4010 Silver St
- 4020 Silver St
- 4030 Silver St
- 4015 Clover Valley Rd
- 4065 Clover Valley Rd
- 4040 Silver St
- 4070 Clover Valley Rd
- 3980 Clover Valley Rd
- 4009 Silver St
- 3990 Clover Valley Rd