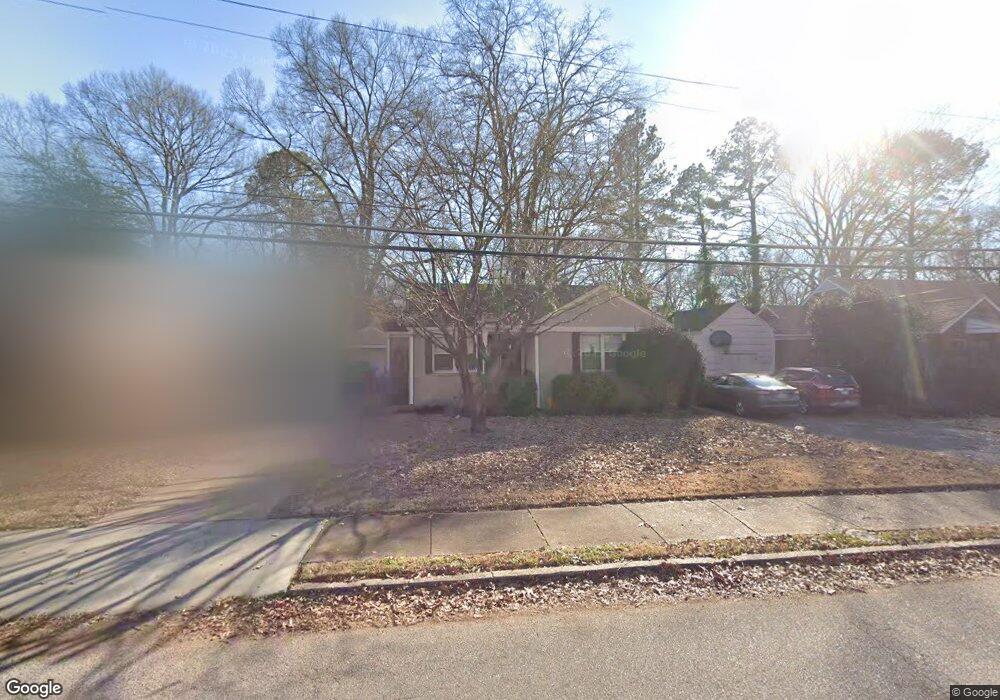
4031 Given Ave Memphis, TN 38122
Berclair NeighborhoodEstimated Value: $163,365 - $213,000
2
Beds
2
Baths
1,516
Sq Ft
$118/Sq Ft
Est. Value
About This Home
This home is located at 4031 Given Ave, Memphis, TN 38122 and is currently estimated at $178,591, approximately $117 per square foot. 4031 Given Ave is a home located in Shelby County with nearby schools including Grahamwood Elementary School, Kingsbury High School, and Treadwell Middle School.
Ownership History
Date
Name
Owned For
Owner Type
Purchase Details
Closed on
Oct 29, 2020
Sold by
Thomas Lisa and Thomas Scott
Bought by
Stevens Family Rlt
Current Estimated Value
Home Financials for this Owner
Home Financials are based on the most recent Mortgage that was taken out on this home.
Original Mortgage
$99,000
Outstanding Balance
$88,096
Interest Rate
2.8%
Mortgage Type
New Conventional
Estimated Equity
$90,495
Purchase Details
Closed on
May 15, 2009
Sold by
Mccabe David Michael and Mccabe Michele
Bought by
Totty Lisa Renee
Home Financials for this Owner
Home Financials are based on the most recent Mortgage that was taken out on this home.
Original Mortgage
$86,193
Interest Rate
4.89%
Mortgage Type
FHA
Purchase Details
Closed on
Jun 28, 2004
Sold by
Ross Lyndell Irene and Ross Lyndell M
Bought by
Mccabe David Michael
Home Financials for this Owner
Home Financials are based on the most recent Mortgage that was taken out on this home.
Original Mortgage
$67,200
Interest Rate
6.25%
Mortgage Type
Purchase Money Mortgage
Create a Home Valuation Report for This Property
The Home Valuation Report is an in-depth analysis detailing your home's value as well as a comparison with similar homes in the area
Home Values in the Area
Average Home Value in this Area
Purchase History
| Date | Buyer | Sale Price | Title Company |
|---|---|---|---|
| Stevens Family Rlt | $126,000 | None Available | |
| Totty Lisa Renee | $88,000 | First National Financial Tit | |
| Mccabe David Michael | $84,000 | -- |
Source: Public Records
Mortgage History
| Date | Status | Borrower | Loan Amount |
|---|---|---|---|
| Open | Stevens Family Rlt | $99,000 | |
| Previous Owner | Totty Lisa Renee | $86,193 | |
| Previous Owner | Mccabe David Michael | $67,200 |
Source: Public Records
Tax History
| Year | Tax Paid | Tax Assessment Tax Assessment Total Assessment is a certain percentage of the fair market value that is determined by local assessors to be the total taxable value of land and additions on the property. | Land | Improvement |
|---|---|---|---|---|
| 2025 | $967 | $39,950 | $6,750 | $33,200 |
| 2024 | $967 | $28,525 | $3,750 | $24,775 |
| 2023 | $1,738 | $28,525 | $3,750 | $24,775 |
| 2022 | $1,738 | $28,525 | $3,750 | $24,775 |
| 2021 | $1,758 | $28,525 | $3,750 | $24,775 |
| 2020 | $574 | $17,975 | $2,375 | $15,600 |
| 2019 | $574 | $17,975 | $2,375 | $15,600 |
| 2018 | $574 | $17,975 | $2,375 | $15,600 |
| 2017 | $588 | $17,975 | $2,375 | $15,600 |
| 2016 | $707 | $16,175 | $0 | $0 |
| 2014 | $707 | $16,175 | $0 | $0 |
Source: Public Records
Map
Nearby Homes
- 4124 Given Ave
- 989 Wingfield Rd
- 1020 Sandra St
- 928 Chatwood St
- 1026 Wingfield Rd
- 3902 Guernsey Ave
- 1025 Tatum Rd
- 791 Chatwood Cove
- 4037 Graham Oaks Ct Unit 30
- 781 Chatwood Cove
- 4040 Graham Oaks Ct Unit 21
- 779 Chatwood Cove
- 4207 Brenmar Ave
- 822 Eastern Dr
- 3882 Tutwiler Ave
- 3807 Guernsey Ave
- 4138 Macon Rd
- 3793 Guernsey Ave
- 4227 Tutwiler Ave
- 4287 Elaine Ave
- 4039 Given Ave
- 4025 Given Ave
- 4047 Given Ave
- 4057 Given Ave
- 916 N Graham St
- 908 N Graham St
- 4026 Given Ave
- 4046 Given Ave
- 898 N Graham St
- 4061 Given Ave
- 4036 Given Ave
- 4054 Given Ave
- 0 Sanders Rd
- 4067 Given Ave
- 930 N Graham St
- 888 N Graham St
- 4026 Owen Rd
- 945 Sandra St
- 4073 Given Ave
- 950 N Graham St
Your Personal Tour Guide
Ask me questions while you tour the home.