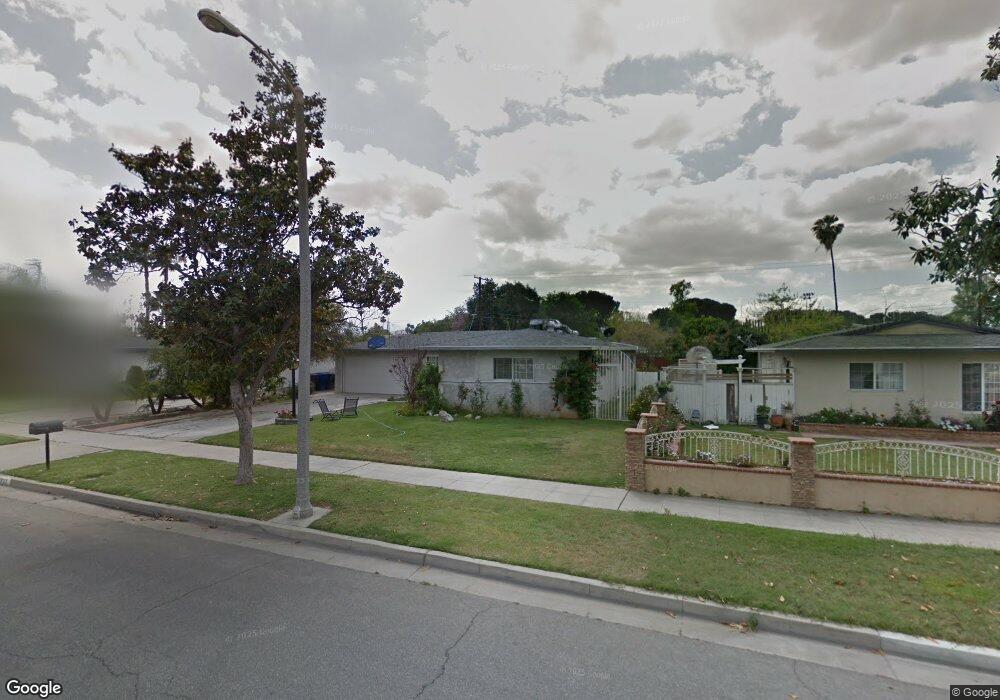
4032 Manchester Place Riverside, CA 92503
Ramona NeighborhoodEstimated Value: $612,000 - $654,000
5
Beds
2
Baths
1,778
Sq Ft
$356/Sq Ft
Est. Value
About This Home
This home is located at 4032 Manchester Place, Riverside, CA 92503 and is currently estimated at $632,676, approximately $355 per square foot. 4032 Manchester Place is a home located in Riverside County with nearby schools including Monroe Elementary School, Chemawa Middle School, and Arlington High School.
Ownership History
Date
Name
Owned For
Owner Type
Purchase Details
Closed on
Jan 6, 2010
Sold by
Federal National Mortgage Association
Bought by
Guiraiz Allauddin and Siddiqi Shaheen
Current Estimated Value
Home Financials for this Owner
Home Financials are based on the most recent Mortgage that was taken out on this home.
Original Mortgage
$196,377
Outstanding Balance
$128,671
Interest Rate
4.91%
Mortgage Type
FHA
Estimated Equity
$504,005
Purchase Details
Closed on
Jul 16, 2009
Sold by
Cosner Tina Y and Cosner Timothy A
Bought by
Federal National Mortgage Association
Purchase Details
Closed on
Jan 5, 2004
Sold by
Kozna John H and Kozna Mary Jeanne
Bought by
Cosner Timothy Allan and Cosner Tina Yun
Home Financials for this Owner
Home Financials are based on the most recent Mortgage that was taken out on this home.
Original Mortgage
$216,000
Interest Rate
5.86%
Mortgage Type
Credit Line Revolving
Create a Home Valuation Report for This Property
The Home Valuation Report is an in-depth analysis detailing your home's value as well as a comparison with similar homes in the area
Home Values in the Area
Average Home Value in this Area
Purchase History
| Date | Buyer | Sale Price | Title Company |
|---|---|---|---|
| Guiraiz Allauddin | $200,000 | Landsafe Title California | |
| Federal National Mortgage Association | $287,306 | Landsafe Title | |
| Cosner Timothy Allan | $270,000 | Commonwealth Land Title |
Source: Public Records
Mortgage History
| Date | Status | Borrower | Loan Amount |
|---|---|---|---|
| Open | Guiraiz Allauddin | $196,377 | |
| Previous Owner | Cosner Timothy Allan | $216,000 | |
| Closed | Cosner Timothy Allan | $54,000 |
Source: Public Records
Tax History
| Year | Tax Paid | Tax Assessment Tax Assessment Total Assessment is a certain percentage of the fair market value that is determined by local assessors to be the total taxable value of land and additions on the property. | Land | Improvement |
|---|---|---|---|---|
| 2025 | $2,759 | $258,144 | $129,073 | $129,071 |
| 2023 | $2,759 | $248,122 | $124,062 | $124,060 |
| 2022 | $5,231 | $243,258 | $121,630 | $121,628 |
| 2021 | $5,203 | $238,490 | $119,246 | $119,244 |
| 2020 | $5,137 | $236,046 | $118,024 | $118,022 |
| 2019 | $5,087 | $231,418 | $115,710 | $115,708 |
| 2018 | $5,030 | $226,882 | $113,441 | $113,441 |
| 2017 | $4,964 | $222,434 | $111,217 | $111,217 |
| 2016 | $2,338 | $218,074 | $109,037 | $109,037 |
| 2015 | $2,304 | $214,800 | $107,400 | $107,400 |
| 2014 | $2,280 | $210,596 | $105,298 | $105,298 |
Source: Public Records
Map
Nearby Homes
- 4127 Goodman St
- 4117 Bel Air St
- 3869 Lafayette St
- 3878 Lafayette St
- 9293 Garfield St
- 3875 Everest Ave
- 3867 Roblynn St
- 4041 Mcarthur Rd
- 8960 Delano Dr
- 9075 Delano Dr
- 3914 Mckenzie St
- 9152 Jersey Dr
- 4363 Santee Place
- 8943 Delano Dr
- 9413 Garfield St
- 3924 Wayne Ct
- 9269 Delano Dr
- 9460 Garfield St
- 8673 Camelia Dr
- 9391 California Ave Unit 97
- 4022 Manchester Place
- 4042 Manchester Place
- 4031 Sherman Dr
- 4012 Manchester Place
- 4052 Manchester Place
- 4021 Sherman Dr
- 4041 Sherman Dr
- 4031 Manchester Place
- 4011 Sherman Dr
- 4051 Sherman Dr
- 4021 Manchester Place
- 4041 Manchester Place
- 4062 Manchester Place
- 8902 Sherman Dr
- 4011 Manchester Place
- 4051 Manchester Place
- 4061 Sherman Dr
- 3992 Manchester Place
- 4032 Overland St
- 4072 Manchester Place
Your Personal Tour Guide
Ask me questions while you tour the home.