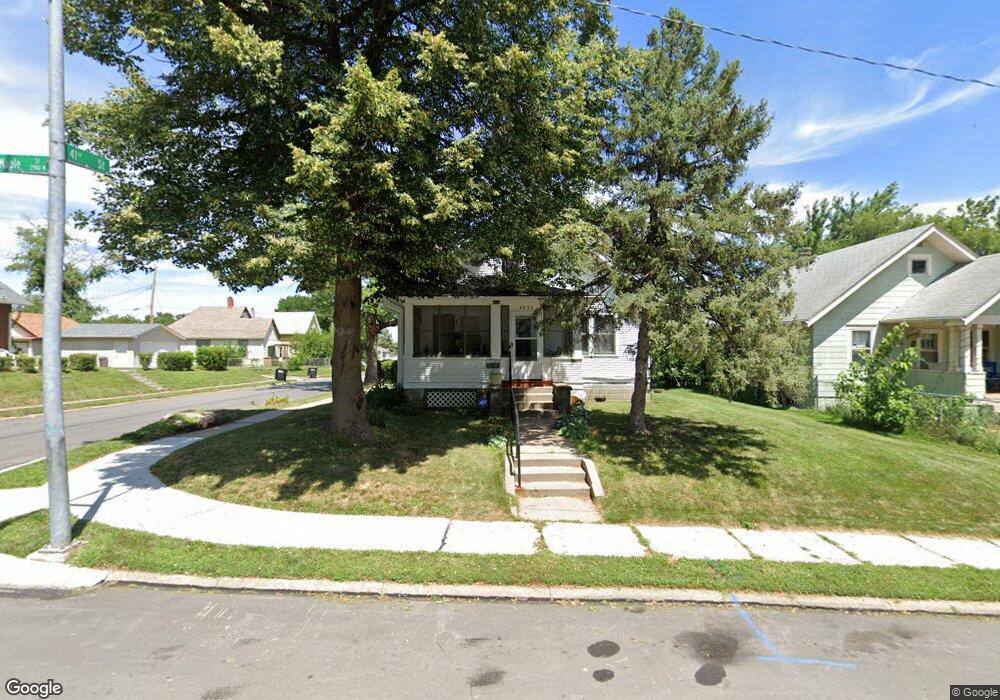
4032 Maple St Omaha, NE 68111
Malcolm X NeighborhoodEstimated Value: $151,436 - $198,000
5
Beds
4
Baths
1,582
Sq Ft
$111/Sq Ft
Est. Value
About This Home
This home is located at 4032 Maple St, Omaha, NE 68111 and is currently estimated at $174,859, approximately $110 per square foot. 4032 Maple St is a home located in Douglas County with nearby schools including King Elementary School, Monroe Middle School, and Benson Magnet High School.
Ownership History
Date
Name
Owned For
Owner Type
Purchase Details
Closed on
Oct 22, 2007
Sold by
Rieman Michael
Bought by
Gude Jon
Current Estimated Value
Purchase Details
Closed on
Feb 27, 2007
Sold by
Citifinacial Mortgage Company
Bought by
Rieman Michael
Purchase Details
Closed on
May 18, 2006
Sold by
Eric H Lindquist
Bought by
Citi Financial Mortgage Company
Purchase Details
Closed on
Jul 24, 2001
Sold by
Thomas Edward Llc
Bought by
Bils Bonnie L
Home Financials for this Owner
Home Financials are based on the most recent Mortgage that was taken out on this home.
Original Mortgage
$63,900
Interest Rate
7.05%
Mortgage Type
Purchase Money Mortgage
Create a Home Valuation Report for This Property
The Home Valuation Report is an in-depth analysis detailing your home's value as well as a comparison with similar homes in the area
Home Values in the Area
Average Home Value in this Area
Purchase History
| Date | Buyer | Sale Price | Title Company |
|---|---|---|---|
| Gude Jon | $107,000 | -- | |
| Rieman Michael | $46,000 | -- | |
| Citi Financial Mortgage Company | $57,100 | -- | |
| Bils Bonnie L | $71,000 | -- |
Source: Public Records
Mortgage History
| Date | Status | Borrower | Loan Amount |
|---|---|---|---|
| Previous Owner | Bils Bonnie L | $63,900 |
Source: Public Records
Tax History
| Year | Tax Paid | Tax Assessment Tax Assessment Total Assessment is a certain percentage of the fair market value that is determined by local assessors to be the total taxable value of land and additions on the property. | Land | Improvement |
|---|---|---|---|---|
| 2025 | $1,617 | $123,700 | $7,700 | $116,000 |
| 2024 | $2,110 | $100,000 | $7,700 | $92,300 |
| 2023 | $2,110 | $100,000 | $7,700 | $92,300 |
| 2022 | $1,712 | $80,200 | $7,700 | $72,500 |
| 2021 | $1,697 | $80,200 | $7,700 | $72,500 |
| 2020 | $1,610 | $75,200 | $7,700 | $67,500 |
| 2019 | $1,527 | $71,100 | $800 | $70,300 |
| 2018 | $1,529 | $71,100 | $800 | $70,300 |
| 2017 | $1,206 | $55,800 | $800 | $55,000 |
| 2016 | $1,240 | $57,800 | $700 | $57,100 |
| 2015 | $1,685 | $79,600 | $2,500 | $77,100 |
| 2014 | $1,685 | $79,600 | $2,500 | $77,100 |
Source: Public Records
Map
Nearby Homes
Your Personal Tour Guide
Ask me questions while you tour the home.