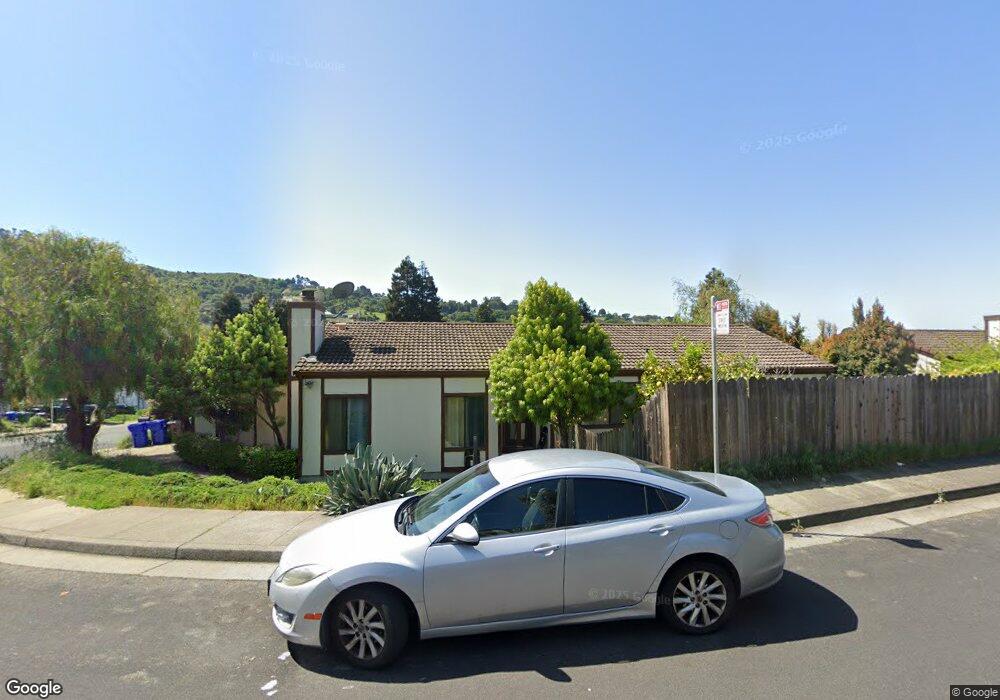
4036 Minuet Cir El Sobrante, CA 94803
Estimated Value: $599,000 - $770,000
3
Beds
2
Baths
1,357
Sq Ft
$490/Sq Ft
Est. Value
About This Home
This home is located at 4036 Minuet Cir, El Sobrante, CA 94803 and is currently estimated at $664,860, approximately $489 per square foot. 4036 Minuet Cir is a home located in Contra Costa County with nearby schools including Sheldon Elementary School, Betty Reid Soskin Middle School, and De Anza Senior High School.
Ownership History
Date
Name
Owned For
Owner Type
Purchase Details
Closed on
Oct 7, 2012
Sold by
Yu Kenneth and Yu Lawrence
Bought by
Yu Kenneth and Yu Lawrence
Current Estimated Value
Home Financials for this Owner
Home Financials are based on the most recent Mortgage that was taken out on this home.
Original Mortgage
$344,354
Interest Rate
3.5%
Mortgage Type
New Conventional
Purchase Details
Closed on
Jan 17, 2007
Sold by
Yu Lawrence and Yu Amy
Bought by
Yu Kenneth and Yu Lawrence
Home Financials for this Owner
Home Financials are based on the most recent Mortgage that was taken out on this home.
Original Mortgage
$368,900
Interest Rate
6.1%
Mortgage Type
Stand Alone Refi Refinance Of Original Loan
Purchase Details
Closed on
Jan 15, 2003
Sold by
Yu Albert M and Szeto Sau Man
Bought by
Yu Lawrence and Yu Amy
Home Financials for this Owner
Home Financials are based on the most recent Mortgage that was taken out on this home.
Original Mortgage
$130,000
Interest Rate
5.96%
Mortgage Type
Purchase Money Mortgage
Create a Home Valuation Report for This Property
The Home Valuation Report is an in-depth analysis detailing your home's value as well as a comparison with similar homes in the area
Home Values in the Area
Average Home Value in this Area
Purchase History
| Date | Buyer | Sale Price | Title Company |
|---|---|---|---|
| Yu Kenneth | -- | Servicelink | |
| Yu Kenneth | -- | Chicago Title Co | |
| Yu Lawrence | $130,000 | First American Title |
Source: Public Records
Mortgage History
| Date | Status | Borrower | Loan Amount |
|---|---|---|---|
| Closed | Yu Kenneth | $344,354 | |
| Closed | Yu Kenneth | $368,900 | |
| Closed | Yu Lawrence | $130,000 |
Source: Public Records
Tax History Compared to Growth
Tax History
| Year | Tax Paid | Tax Assessment Tax Assessment Total Assessment is a certain percentage of the fair market value that is determined by local assessors to be the total taxable value of land and additions on the property. | Land | Improvement |
|---|---|---|---|---|
| 2025 | $5,073 | $279,588 | $120,611 | $158,977 |
| 2024 | $4,959 | $274,107 | $118,247 | $155,860 |
| 2023 | $4,959 | $268,733 | $115,929 | $152,804 |
| 2022 | $4,877 | $263,464 | $113,656 | $149,808 |
| 2021 | $4,836 | $258,299 | $111,428 | $146,871 |
| 2019 | $4,586 | $250,640 | $108,124 | $142,516 |
| 2018 | $4,406 | $245,726 | $106,004 | $139,722 |
| 2017 | $4,288 | $240,909 | $103,926 | $136,983 |
| 2016 | $4,211 | $236,187 | $101,889 | $134,298 |
| 2015 | $4,174 | $232,640 | $100,359 | $132,281 |
| 2014 | $4,135 | $228,084 | $98,394 | $129,690 |
Source: Public Records
Map
Nearby Homes
- 4047 Mozart Dr
- 3760 Via Verdi
- 3764 Via Verdi Unit 13
- 4091 Garden Rd
- 4022 San Pablo Dam Rd
- 0 Montera Ct
- 3034 Parker Rd
- 3706 Montera Ct
- 3275 Annapolis Ave
- 3027 Colette Dr
- 10 Dove Ln
- 3944 La Cima Rd
- 742 Alhambra Rd
- 57 Parkview Terrace
- 4556 Appian Way Unit 36
- 4556 Appian Way Unit 12
- 6253 Bayview Ave
- 6324 Bonita Ct
- 476 Colina Way
- 4370 Wesley Way
- 4046 Minuet Cir
- 4050 Minuet Cir
- 4026 Minuet Cir
- 4016 Minuet Cir
- 4054 Minuet Cir
- 4035 Minuet Cir
- 4039 Minuet Cir
- 4012 Minuet Cir
- 4031 Minuet Cir
- 4047 Minuet Cir
- 4043 Minuet Cir
- 4058 Minuet Cir
- 4051 Minuet Cir
- 4062 Mozart Dr
- 4055 Minuet Cir
- 4058 Mozart Dr
- 4055 Minuet Cr
- 4008 Minuet Cir
- 4066 Mozart Dr
- 4054 Mozart Dr