4037 Via Ingresso Cypress, CA 90630
Estimated Value: $784,614 - $959,000
3
Beds
2
Baths
1,426
Sq Ft
$591/Sq Ft
Est. Value
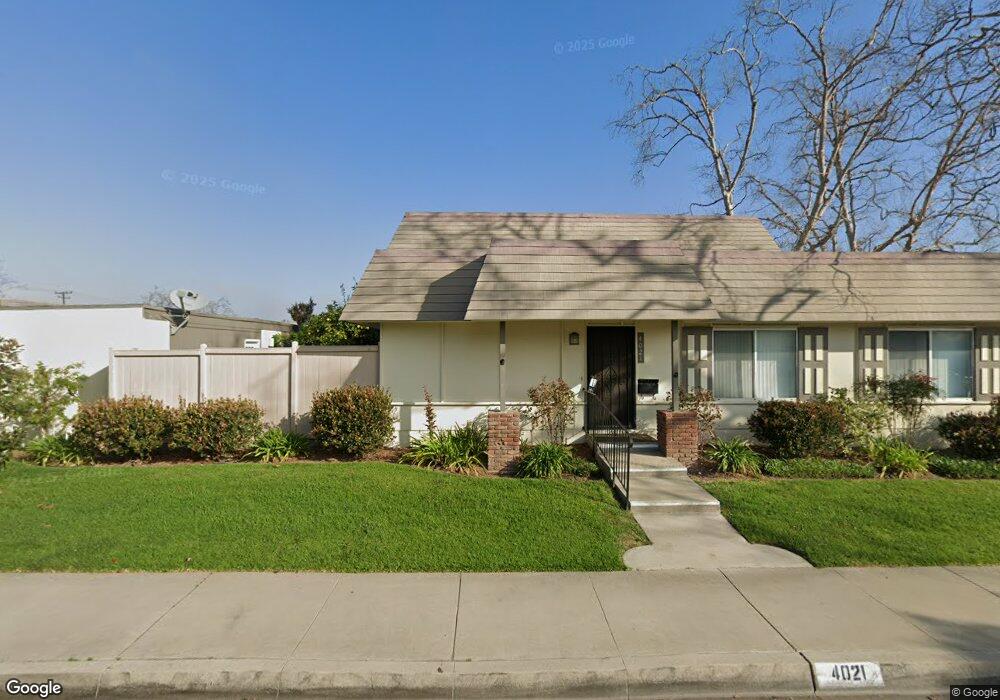
About This Home
This home is located at 4037 Via Ingresso, Cypress, CA 90630 and is currently estimated at $842,404, approximately $590 per square foot. 4037 Via Ingresso is a home located in Orange County with nearby schools including Margaret Landell Elementary School, A.E. Arnold Elementary School, and Lexington Junior High School.
Ownership History
Date
Name
Owned For
Owner Type
Purchase Details
Closed on
Jun 7, 2010
Sold by
Wall Robert L and Wall Michelle D
Bought by
Murphy Loretta R and The Loretta R Murphy Living Trust
Current Estimated Value
Home Financials for this Owner
Home Financials are based on the most recent Mortgage that was taken out on this home.
Original Mortgage
$311,250
Interest Rate
4.71%
Mortgage Type
New Conventional
Purchase Details
Closed on
Apr 23, 2003
Sold by
Wall Robert L and Wall Michelle D
Bought by
Wall Robert L and Wall Michelle D
Home Financials for this Owner
Home Financials are based on the most recent Mortgage that was taken out on this home.
Original Mortgage
$135,650
Interest Rate
5.84%
Purchase Details
Closed on
Sep 25, 2001
Sold by
Wall Robert Lee and Wall Michelle Denise
Bought by
Wall Robert L and Wall Michelle D
Create a Home Valuation Report for This Property
The Home Valuation Report is an in-depth analysis detailing your home's value as well as a comparison with similar homes in the area
Home Values in the Area
Average Home Value in this Area
Purchase History
| Date | Buyer | Sale Price | Title Company |
|---|---|---|---|
| Murphy Loretta R | $415,000 | Chicago Title Company | |
| Wall Robert L | -- | Southland Title Corporation | |
| Wall Robert L | -- | -- |
Source: Public Records
Mortgage History
| Date | Status | Borrower | Loan Amount |
|---|---|---|---|
| Previous Owner | Murphy Loretta R | $311,250 | |
| Previous Owner | Wall Robert L | $135,650 |
Source: Public Records
Tax History Compared to Growth
Tax History
| Year | Tax Paid | Tax Assessment Tax Assessment Total Assessment is a certain percentage of the fair market value that is determined by local assessors to be the total taxable value of land and additions on the property. | Land | Improvement |
|---|---|---|---|---|
| 2025 | $5,976 | $531,682 | $436,990 | $94,692 |
| 2024 | $5,976 | $521,257 | $428,421 | $92,836 |
| 2023 | $5,838 | $511,037 | $420,021 | $91,016 |
| 2022 | $5,769 | $501,017 | $411,785 | $89,232 |
| 2021 | $5,693 | $491,194 | $403,711 | $87,483 |
| 2020 | $5,670 | $486,158 | $399,572 | $86,586 |
| 2019 | $5,510 | $476,626 | $391,737 | $84,889 |
| 2018 | $5,435 | $467,281 | $384,056 | $83,225 |
| 2017 | $5,248 | $458,119 | $376,525 | $81,594 |
| 2016 | $5,203 | $449,137 | $369,142 | $79,995 |
| 2015 | $4,861 | $415,000 | $341,083 | $73,917 |
| 2014 | $4,689 | $415,000 | $341,083 | $73,917 |
Source: Public Records
Map
Nearby Homes
- 9686 Bloomfield Ave
- 3621 Halbrite Ave
- 9824 Via Sonoma
- 22221 Bloomfield Ave Unit 47
- 4326 Via Verde
- 4192 Larwin Ave
- 8065 E Ring St
- 10202 Aqueduct Dr
- 10232 Hialeah Dr
- 22414 Horst Ave
- 9080 Bloomfield St Unit 231
- 9080 Bloomfield St Unit 145
- 22315 Ibex Ave
- 9080 Bloomfield Ave Unit 31
- 9080 Bloomfield Ave Unit 237
- 9080 Bloomfield Ave Unit 223
- 9080 Bloomfield Ave Unit 79
- 9080 Bloomfield Ave Unit 126
- 9080 Bloomfield Ave Unit 33
- 9080 Bloomfield Ave Unit 72
- 4033 Via Ingresso
- 4041 Via Ingresso
- 4029 Via Ingresso
- 4045 Via Ingresso
- 4025 Via Ingresso
- 4049 Via Ingresso
- 9679 Paseo de Oro
- 9677 Paseo de Oro
- 9680 Bloomfield Ave
- 9676 Bloomfield Ave
- 9682 Bloomfield Ave
- 9676 Bloomfield St
- 9672 Bloomfield Ave
- 9675 Paseo de Oro
- 9668 Bloomfield Ave
- 9688 Bloomfield Ave
- 4069 Via Ingresso
- 9692 Bloomfield Ave
- 9634 Bloomfield Ave
- 9626 Bloomfield Ave