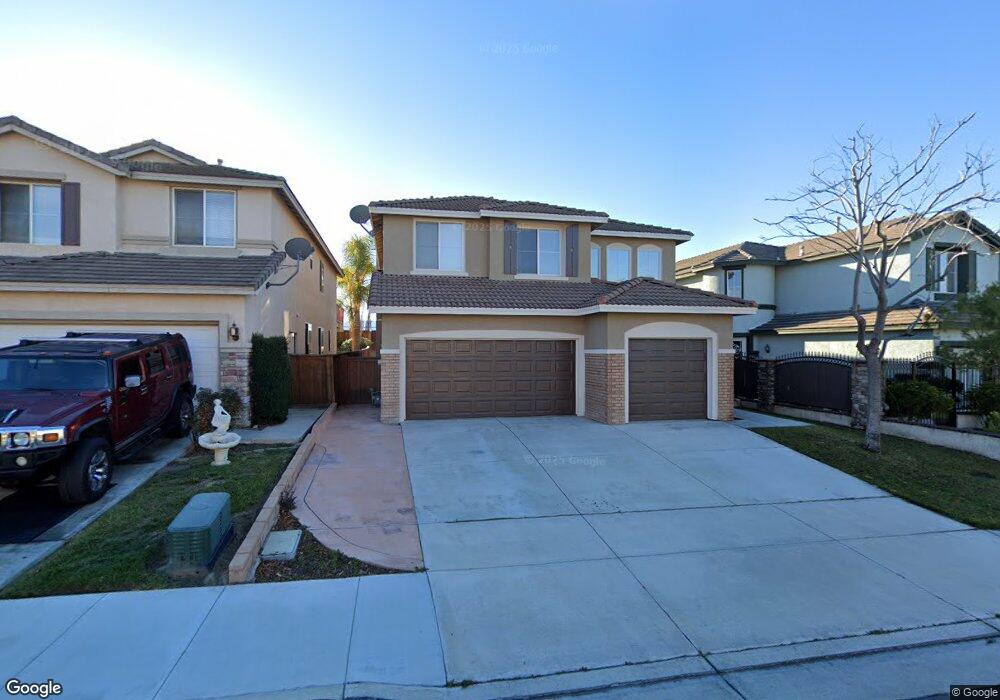
40392 Chantemar Way Temecula, CA 92591
Meadowview NeighborhoodEstimated Value: $721,342 - $772,000
4
Beds
3
Baths
2,427
Sq Ft
$309/Sq Ft
Est. Value
About This Home
This home is located at 40392 Chantemar Way, Temecula, CA 92591 and is currently estimated at $749,336, approximately $308 per square foot. 40392 Chantemar Way is a home located in Riverside County with nearby schools including Nicolas Valley Elementary School, James L. Day Middle School, and Chaparral High School.
Ownership History
Date
Name
Owned For
Owner Type
Purchase Details
Closed on
Feb 8, 2011
Sold by
Granados David A and Granados Elaine D
Bought by
Jenkins Michael and Jenkins Sonia
Current Estimated Value
Home Financials for this Owner
Home Financials are based on the most recent Mortgage that was taken out on this home.
Original Mortgage
$280,912
Outstanding Balance
$192,130
Interest Rate
4.77%
Mortgage Type
VA
Estimated Equity
$557,206
Purchase Details
Closed on
Nov 22, 2000
Sold by
Woodside Chantemar Inc
Bought by
Granados David A and Granados Elaine D
Home Financials for this Owner
Home Financials are based on the most recent Mortgage that was taken out on this home.
Original Mortgage
$210,200
Interest Rate
7.86%
Create a Home Valuation Report for This Property
The Home Valuation Report is an in-depth analysis detailing your home's value as well as a comparison with similar homes in the area
Home Values in the Area
Average Home Value in this Area
Purchase History
| Date | Buyer | Sale Price | Title Company |
|---|---|---|---|
| Jenkins Michael | $275,000 | Ticor Title Company Of Ca | |
| Granados David A | $221,500 | First American Title Co |
Source: Public Records
Mortgage History
| Date | Status | Borrower | Loan Amount |
|---|---|---|---|
| Open | Jenkins Michael | $280,912 | |
| Previous Owner | Granados David A | $210,200 |
Source: Public Records
Tax History
| Year | Tax Paid | Tax Assessment Tax Assessment Total Assessment is a certain percentage of the fair market value that is determined by local assessors to be the total taxable value of land and additions on the property. | Land | Improvement |
|---|---|---|---|---|
| 2025 | $4,490 | $352,309 | $76,863 | $275,446 |
| 2023 | $4,490 | $338,630 | $73,879 | $264,751 |
| 2022 | $7,093 | $331,991 | $72,431 | $259,560 |
| 2021 | $7,003 | $325,482 | $71,011 | $254,471 |
| 2020 | $6,913 | $322,145 | $70,283 | $251,862 |
| 2019 | $6,853 | $315,829 | $68,905 | $246,924 |
| 2018 | $6,768 | $309,637 | $67,555 | $242,082 |
| 2017 | $6,678 | $303,567 | $66,231 | $237,336 |
| 2016 | $3,937 | $297,616 | $64,933 | $232,683 |
| 2015 | $3,870 | $293,147 | $63,958 | $229,189 |
| 2014 | $3,758 | $287,406 | $62,706 | $224,700 |
Source: Public Records
Map
Nearby Homes
- 27590 Nellie Ct
- 40243 Mimulus Way
- 40591 Chantemar Way
- 27536 Swallow Ct
- 27546 Senna Ct
- 29049 Portland Ct
- 41070 Avenida Verde
- 29928 Valle Olvera
- 39560 Linnit Cir
- 40122 Stowe Rd
- 41480 Luz Del Sol
- 30041 Los Nogales Rd
- 28848 Laurel Ln
- 40265 Danbury Ct
- 39885 Rustic Glen Dr
- 27668 Parkside Dr
- 28550 Via Prago
- 28824 Bristol Rd
- 39714 Rustic Glen Dr
- 28389 Via Solero
- 40382 Chantemar Way
- 40402 Chantemar Way
- 40372 Chantemar Way
- 40410 Chantemar Way
- 40362 Chantemar Way
- 27598 Campana Cir
- 40352 Chantemar Way
- 27595 Nellie Ct
- 40426 Chantemar Way
- 27597 Campana Cir
- 40342 Chantemar Way
- 40434 Chantemar Way
- 27578 Campana Cir
- 27587 Campana Cir
- 40332 Chantemar Way
- 40444 Chantemar Way
- 27575 Nellie Ct
- 27568 Campana Cir
- 27577 Campana Cir
- 40450 Chantemar Way
Your Personal Tour Guide
Ask me questions while you tour the home.