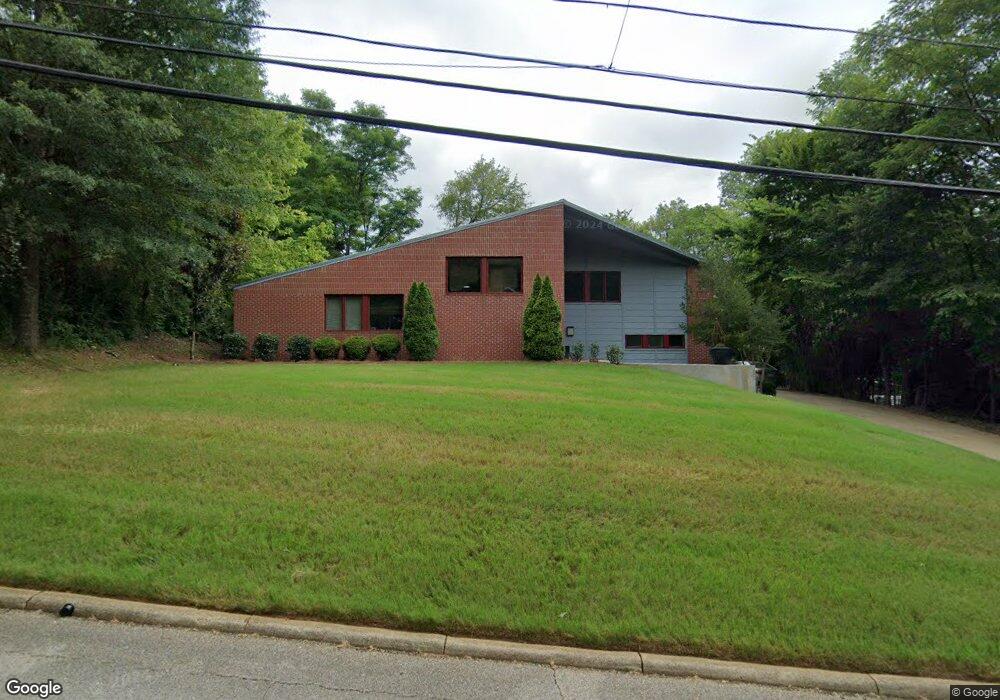
404 E Main St New Albany, MS 38652
Estimated Value: $272,000 - $384,000
3
Beds
2
Baths
2,137
Sq Ft
$147/Sq Ft
Est. Value
About This Home
This home is located at 404 E Main St, New Albany, MS 38652 and is currently estimated at $314,855, approximately $147 per square foot. 404 E Main St is a home with nearby schools including New Albany Elementary School, New Albany/S.Tippah/Union County Alternative School, and New Albany Middle School.
Ownership History
Date
Name
Owned For
Owner Type
Purchase Details
Closed on
Aug 29, 2016
Sold by
Speck Jeffery A and Speck Donna K
Bought by
Garrett Charles R and Garrett Sarah
Current Estimated Value
Home Financials for this Owner
Home Financials are based on the most recent Mortgage that was taken out on this home.
Original Mortgage
$113,000
Outstanding Balance
$10,988
Interest Rate
3.48%
Mortgage Type
Purchase Money Mortgage
Estimated Equity
$303,867
Purchase Details
Closed on
Jun 26, 2013
Sold by
Porter Ted Trussell
Bought by
Speck Jeffrey A and Speck Donna K
Create a Home Valuation Report for This Property
The Home Valuation Report is an in-depth analysis detailing your home's value as well as a comparison with similar homes in the area
Home Values in the Area
Average Home Value in this Area
Purchase History
| Date | Buyer | Sale Price | Title Company |
|---|---|---|---|
| Garrett Charles R | -- | -- | |
| Speck Jeffrey A | -- | -- |
Source: Public Records
Mortgage History
| Date | Status | Borrower | Loan Amount |
|---|---|---|---|
| Open | Garrett Charles R | $113,000 |
Source: Public Records
Tax History
| Year | Tax Paid | Tax Assessment Tax Assessment Total Assessment is a certain percentage of the fair market value that is determined by local assessors to be the total taxable value of land and additions on the property. | Land | Improvement |
|---|---|---|---|---|
| 2025 | $2,630 | $19,918 | $0 | $0 |
| 2024 | $2,551 | $19,918 | $0 | $0 |
| 2023 | $2,560 | $19,918 | $0 | $0 |
| 2022 | $2,035 | $16,205 | $0 | $0 |
| 2021 | $1,970 | $16,205 | $0 | $0 |
| 2020 | $1,970 | $16,205 | $0 | $0 |
| 2019 | $1,964 | $16,165 | $0 | $0 |
| 2018 | $1,840 | $15,271 | $0 | $0 |
| 2017 | $1,886 | $16,052 | $0 | $0 |
| 2016 | $1,813 | $16,052 | $0 | $0 |
| 2015 | -- | $16,052 | $0 | $0 |
| 2014 | -- | $15,064 | $0 | $0 |
Source: Public Records
Map
Nearby Homes
Your Personal Tour Guide
Ask me questions while you tour the home.