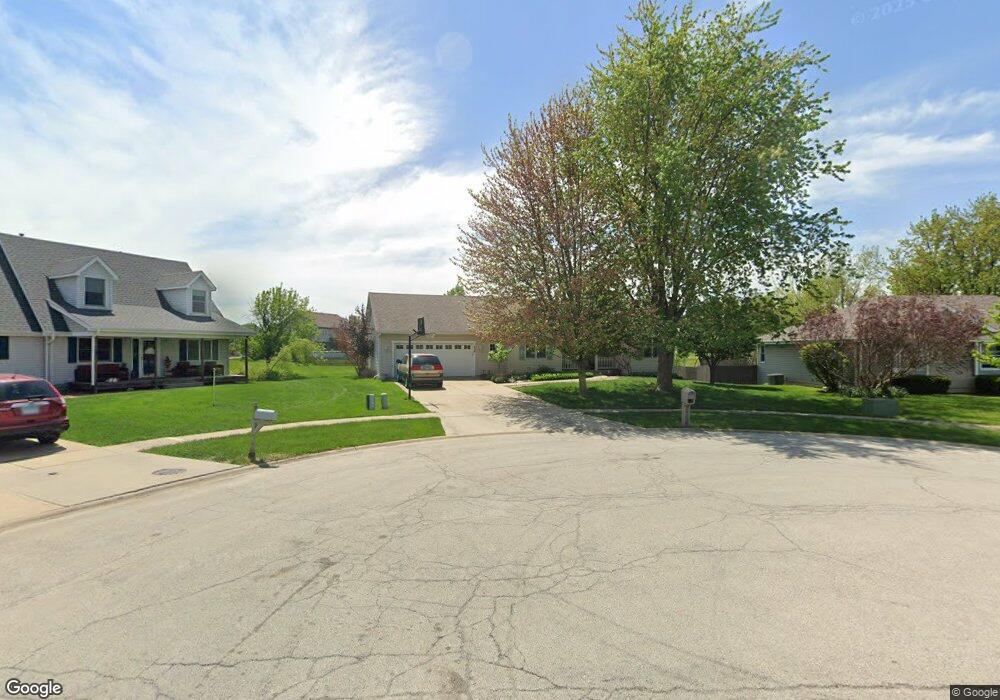
404 Mccoy Ct Minooka, IL 60447
Estimated Value: $345,705 - $412,000
Studio
--
Bath
1,752
Sq Ft
$219/Sq Ft
Est. Value
About This Home
This home is located at 404 Mccoy Ct, Minooka, IL 60447 and is currently estimated at $383,676, approximately $218 per square foot. 404 Mccoy Ct is a home with nearby schools including Minooka Primary Center, Minooka Elementary School, and Minooka Junior High School.
Create a Home Valuation Report for This Property
The Home Valuation Report is an in-depth analysis detailing your home's value as well as a comparison with similar homes in the area
Tax History
| Year | Tax Paid | Tax Assessment Tax Assessment Total Assessment is a certain percentage of the fair market value that is determined by local assessors to be the total taxable value of land and additions on the property. | Land | Improvement |
|---|---|---|---|---|
| 2024 | $8,665 | $108,022 | $27,726 | $80,296 |
| 2023 | $7,898 | $98,461 | $25,272 | $73,189 |
| 2022 | $6,862 | $91,549 | $23,498 | $68,051 |
| 2021 | $6,571 | $86,661 | $22,243 | $64,418 |
| 2020 | $6,409 | $82,899 | $21,277 | $61,622 |
| 2019 | $6,051 | $76,758 | $19,701 | $57,057 |
| 2018 | $6,126 | $75,900 | $19,481 | $56,419 |
| 2017 | $5,948 | $72,479 | $18,603 | $53,876 |
| 2016 | $5,555 | $68,037 | $17,463 | $50,574 |
| 2015 | $4,773 | $61,846 | $15,874 | $45,972 |
| 2014 | $4,335 | $58,433 | $14,998 | $43,435 |
| 2013 | $4,455 | $59,220 | $15,200 | $44,020 |
Source: Public Records
Map
Nearby Homes
- LOT 28 O Toole Dr
- 706 O Toole Dr
- 603 Mahoney Dr
- 805 Edgewater Dr
- 714 Joanne Dr
- 807 Back Bay Ct
- 520 High Grove Dr
- 2037 Isabella Ln
- 336 Clover Cir
- 334 Clover Cir
- 332 Clover Cir
- 330 Clover Cir
- 526 Lily Ct
- 1138 Coneflower Ct
- 1105 Clover Dr
- 1137 S Wabena Ave
- LOT 1 Bob Blair Rd
- 800 Maplewood Dr
- 405 W Mondamin St
- 1380 Dahlgren Ln
Your Personal Tour Guide
Ask me questions while you tour the home.