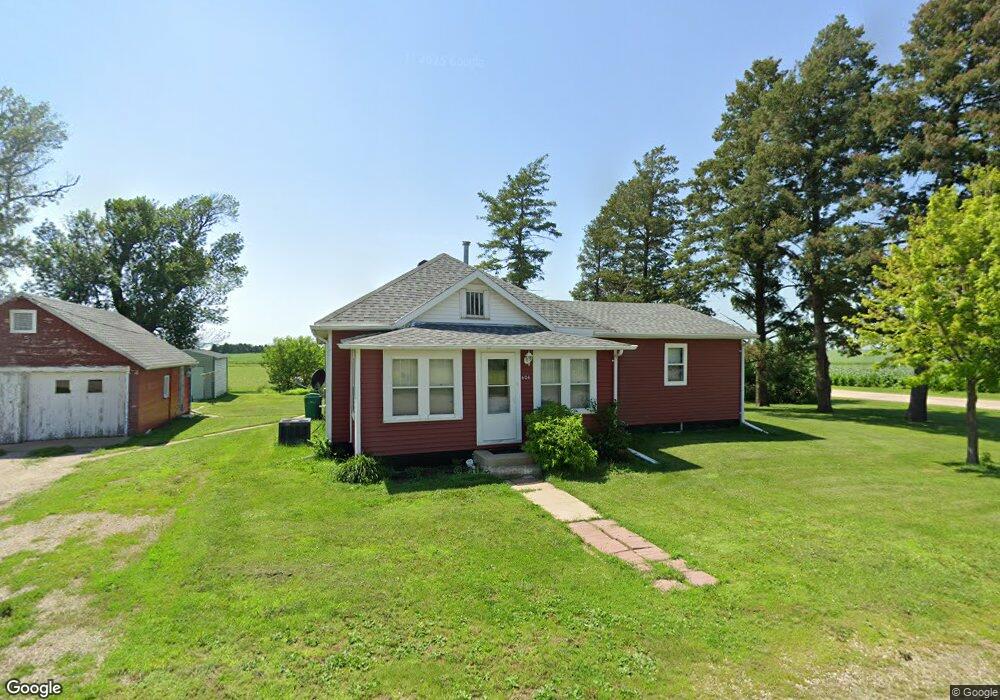
404 N Walnut St Kanawha, IA 50447
Estimated Value: $106,000 - $136,000
3
Beds
1
Bath
1,200
Sq Ft
$100/Sq Ft
Est. Value
About This Home
This home is located at 404 N Walnut St, Kanawha, IA 50447 and is currently estimated at $119,724, approximately $99 per square foot. 404 N Walnut St is a home located in Hancock County with nearby schools including West Hancock Elementary School, West Hancock Middle School, and West Hancock High School.
Ownership History
Date
Name
Owned For
Owner Type
Purchase Details
Closed on
Apr 26, 2017
Sold by
The Estate Of Gregory L Myer
Bought by
Studer Anthony J and Studer Cynthia M
Current Estimated Value
Home Financials for this Owner
Home Financials are based on the most recent Mortgage that was taken out on this home.
Original Mortgage
$12,000
Outstanding Balance
$9,956
Interest Rate
4.1%
Mortgage Type
New Conventional
Estimated Equity
$109,768
Purchase Details
Closed on
Sep 1, 2005
Sold by
Harrigan Marjorie
Bought by
Myer Greg L
Create a Home Valuation Report for This Property
The Home Valuation Report is an in-depth analysis detailing your home's value as well as a comparison with similar homes in the area
Home Values in the Area
Average Home Value in this Area
Purchase History
| Date | Buyer | Sale Price | Title Company |
|---|---|---|---|
| Studer Anthony J | $19,000 | None Available | |
| Myer Greg L | -- | None Available |
Source: Public Records
Mortgage History
| Date | Status | Borrower | Loan Amount |
|---|---|---|---|
| Open | Studer Anthony J | $12,000 |
Source: Public Records
Tax History Compared to Growth
Tax History
| Year | Tax Paid | Tax Assessment Tax Assessment Total Assessment is a certain percentage of the fair market value that is determined by local assessors to be the total taxable value of land and additions on the property. | Land | Improvement |
|---|---|---|---|---|
| 2025 | $1,654 | $116,400 | $19,330 | $97,070 |
| 2024 | $1,654 | $96,190 | $10,310 | $85,880 |
| 2023 | $1,680 | $95,210 | $10,310 | $84,900 |
| 2022 | $1,334 | $85,730 | $10,310 | $75,420 |
| 2021 | $1,290 | $66,480 | $10,310 | $56,170 |
| 2020 | $1,290 | $66,720 | $10,310 | $56,410 |
| 2019 | $1,248 | $66,720 | $10,310 | $56,410 |
| 2018 | $744 | $58,830 | $10,310 | $48,520 |
| 2017 | $786 | $36,350 | $0 | $0 |
| 2016 | $560 | $36,350 | $0 | $0 |
| 2015 | $560 | $35,750 | $0 | $0 |
| 2014 | $522 | $35,750 | $0 | $0 |
Source: Public Records
Map
Nearby Homes