J
Seller's Agent in 2023
Jarrett Tennyson
Coldwell Banker Walden & Kirkland
(229) 344-6183
1 in this area
30 Total Sales
Estimated Value: $175,000 - $238,000
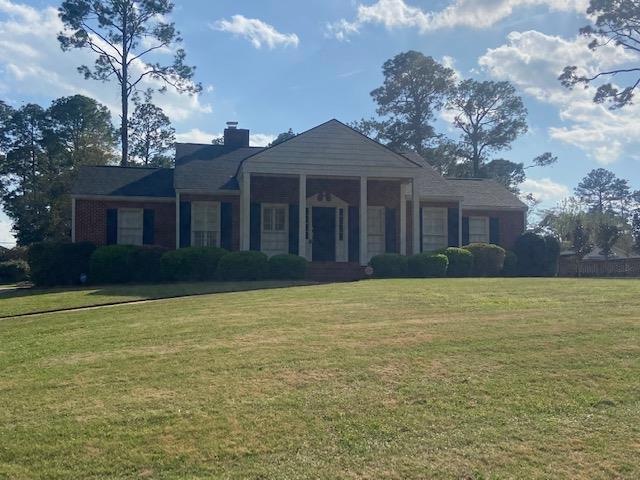
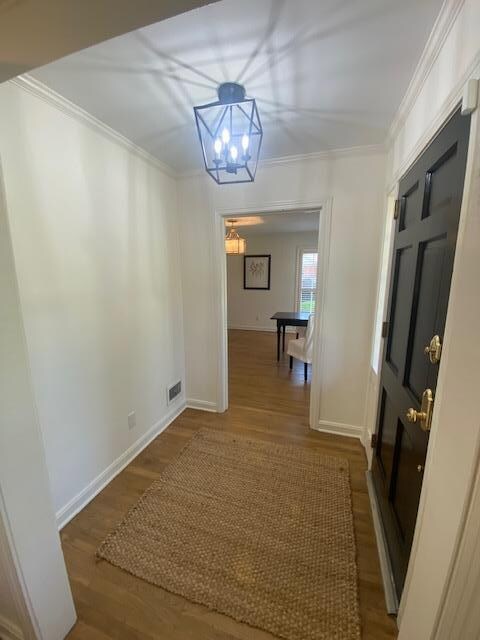
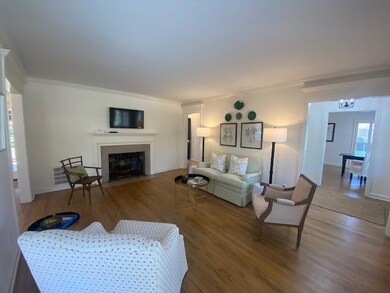
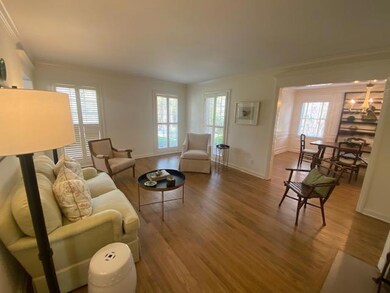
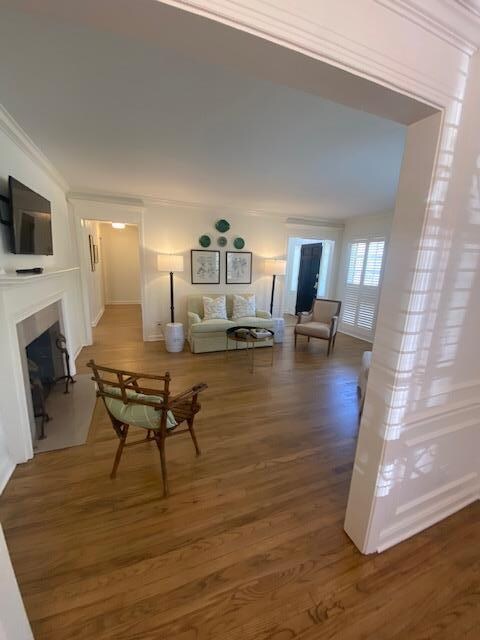
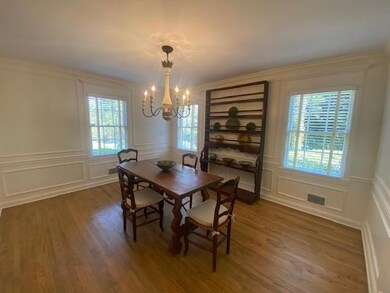
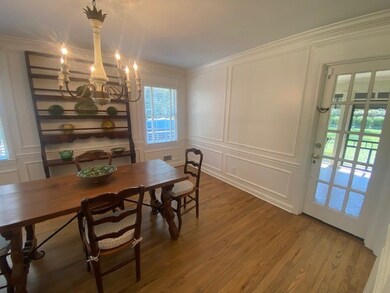
Come and see this beautiful home in one of Albany's oldest and most established neighborhoods. This charming home has hardwood floors throughout and marble in the bathrooms. There is new lighting throughout. The kitchen and bathrooms have been beautifully updated. It is stunning!!! This is a must see!!!
Last Agent to Sell the Property
Coldwell Banker Walden & Kirkland Brokerage Phone: 2294368811 License #408146 Listed on: 03/13/2023

Last Buyer's Agent
Coldwell Banker Walden & Kirkland Brokerage Phone: 2294368811 License #408146 Listed on: 03/13/2023
| Date | Buyer | Sale Price | Title Company |
|---|---|---|---|
| Resnick Michael | $215,000 | -- | |
| Jft Public Properties Llc | $185,000 | -- | |
| Breen Teresa J | -- | -- | |
| Breen Teresa J | $125,000 | -- | |
| Owens Lorene Harris | -- | -- | |
| Owens Inman | -- | -- |
| Date | Status | Borrower | Loan Amount |
|---|---|---|---|
| Previous Owner | Breen Teresa J | $100,000 |
| Date | Event | Price | List to Sale | Price per Sq Ft |
|---|---|---|---|---|
| 04/18/2023 04/18/23 | Sold | $215,000 | -- | $124 / Sq Ft |
| 03/13/2023 03/13/23 | Pending | -- | -- | -- |
| Year | Tax Paid | Tax Assessment Tax Assessment Total Assessment is a certain percentage of the fair market value that is determined by local assessors to be the total taxable value of land and additions on the property. | Land | Improvement |
|---|---|---|---|---|
| 2025 | $2,516 | $49,680 | $11,280 | $38,400 |
| 2024 | $2,516 | $49,680 | $11,280 | $38,400 |
| 2023 | $2,315 | $49,680 | $11,280 | $38,400 |
| 2022 | $2,323 | $49,680 | $11,280 | $38,400 |
| 2021 | $1,916 | $44,200 | $11,280 | $32,920 |
| 2020 | $1,921 | $44,200 | $11,280 | $32,920 |
| 2019 | $1,928 | $44,200 | $11,280 | $32,920 |
| 2018 | $1,829 | $44,200 | $11,280 | $32,920 |
| 2017 | $1,702 | $44,200 | $11,280 | $32,920 |
| 2016 | $1,703 | $44,200 | $11,280 | $32,920 |
| 2015 | $1,706 | $44,200 | $11,280 | $32,920 |
| 2014 | $1,595 | $42,040 | $9,120 | $32,920 |
J
Seller's Agent in 2023
Jarrett Tennyson
Coldwell Banker Walden & Kirkland
(229) 344-6183
1 in this area
30 Total Sales
Source: Albany Board of REALTORS®
MLS Number: 153013
APN: 000GG-00042-015
Ask me questions while you tour the home.