Estimated Value: $58,000 - $106,000
3
Beds
1
Bath
2,596
Sq Ft
$31/Sq Ft
Est. Value
About This Home
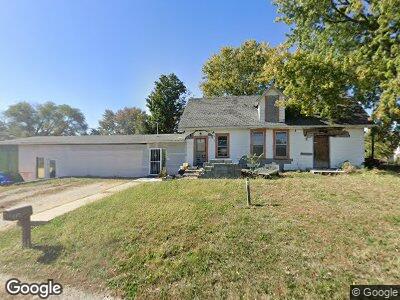
This home is located at 404 S Douglas St, Afton, IA 50830 and is currently estimated at $81,291, approximately $31 per square foot. 404 S Douglas St is a home with nearby schools including East Union Middle/High School.
Ownership History
Date
Name
Owned For
Owner Type
Purchase Details
Closed on
Jan 11, 2013
Sold by
Co Us Reo Fund Nzr Llc
Bought by
Ibbotson Ira
Current Estimated Value
Purchase Details
Closed on
Nov 1, 2012
Sold by
Co Reo Distribution Llc
Bought by
Co Us Reo Fund Nzr Llc
Purchase Details
Closed on
Dec 1, 2006
Sold by
Walter Roxanne and Hughes April
Bought by
Meenen Bethany
Home Financials for this Owner
Home Financials are based on the most recent Mortgage that was taken out on this home.
Original Mortgage
$29,750
Interest Rate
11.87%
Mortgage Type
Adjustable Rate Mortgage/ARM
Create a Home Valuation Report for This Property
The Home Valuation Report is an in-depth analysis detailing your home's value as well as a comparison with similar homes in the area
Home Values in the Area
Average Home Value in this Area
Purchase History
| Date | Buyer | Sale Price | Title Company |
|---|---|---|---|
| Ibbotson Ira | -- | None Available | |
| Co Us Reo Fund Nzr Llc | -- | None Available | |
| Meenen Bethany | $35,000 | None Available |
Source: Public Records
Mortgage History
| Date | Status | Borrower | Loan Amount |
|---|---|---|---|
| Previous Owner | Meenen Bethany | $29,750 |
Source: Public Records
Tax History Compared to Growth
Tax History
| Year | Tax Paid | Tax Assessment Tax Assessment Total Assessment is a certain percentage of the fair market value that is determined by local assessors to be the total taxable value of land and additions on the property. | Land | Improvement |
|---|---|---|---|---|
| 2024 | $906 | $47,430 | $11,700 | $35,730 |
| 2023 | $1,112 | $65,870 | $9,630 | $56,240 |
| 2022 | $1,094 | $61,740 | $9,630 | $52,110 |
| 2021 | $1,094 | $57,700 | $9,000 | $48,700 |
| 2020 | $664 | $40,300 | $5,360 | $34,940 |
| 2019 | $688 | $40,300 | $0 | $0 |
| 2018 | $652 | $40,300 | $0 | $0 |
| 2017 | $652 | $40,300 | $0 | $0 |
| 2016 | $660 | $40,300 | $0 | $0 |
| 2015 | $660 | $36,970 | $0 | $0 |
| 2014 | $590 | $36,970 | $0 | $0 |
Source: Public Records
Map
Nearby Homes