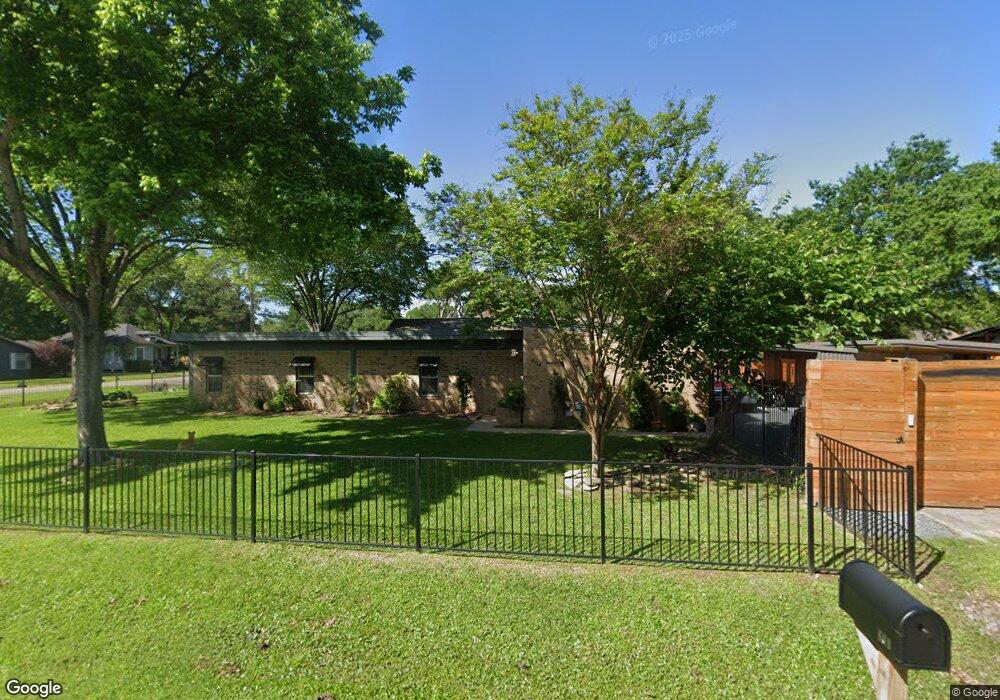
404 S Pine St Tomball, TX 77375
Estimated Value: $328,853 - $394,000
3
Beds
2
Baths
1,792
Sq Ft
$204/Sq Ft
Est. Value
About This Home
This home is located at 404 S Pine St, Tomball, TX 77375 and is currently estimated at $364,963, approximately $203 per square foot. 404 S Pine St is a home located in Harris County with nearby schools including Tomball Elementary School, Tomball Intermediate School, and Tomball Junior High School.
Ownership History
Date
Name
Owned For
Owner Type
Purchase Details
Closed on
Sep 20, 2021
Sold by
City Of Tomball
Bought by
Moore Scott Gordan
Current Estimated Value
Purchase Details
Closed on
Apr 21, 2020
Sold by
Gad Nandan P
Bought by
Moore Scott Gordon and Holland Michelle Ann
Home Financials for this Owner
Home Financials are based on the most recent Mortgage that was taken out on this home.
Original Mortgage
$223,250
Interest Rate
3.3%
Mortgage Type
New Conventional
Purchase Details
Closed on
Dec 29, 1993
Sold by
Scholl Interests
Bought by
Toombs Daniel R and Toombs Patricia A
Home Financials for this Owner
Home Financials are based on the most recent Mortgage that was taken out on this home.
Original Mortgage
$49,400
Interest Rate
7.29%
Mortgage Type
FHA
Create a Home Valuation Report for This Property
The Home Valuation Report is an in-depth analysis detailing your home's value as well as a comparison with similar homes in the area
Home Values in the Area
Average Home Value in this Area
Purchase History
| Date | Buyer | Sale Price | Title Company |
|---|---|---|---|
| Moore Scott Gordan | -- | None Listed On Document | |
| Moore Scott Gordon | -- | None Available | |
| Toombs Daniel R | -- | Title Agency #50 |
Source: Public Records
Mortgage History
| Date | Status | Borrower | Loan Amount |
|---|---|---|---|
| Previous Owner | Moore Scott Gordon | $223,250 | |
| Previous Owner | Toombs Daniel R | $49,400 |
Source: Public Records
Tax History
| Year | Tax Paid | Tax Assessment Tax Assessment Total Assessment is a certain percentage of the fair market value that is determined by local assessors to be the total taxable value of land and additions on the property. | Land | Improvement |
|---|---|---|---|---|
| 2025 | $5,253 | $314,587 | $131,250 | $183,337 |
| 2024 | $5,253 | $351,076 | $122,500 | $228,576 |
| 2023 | $5,253 | $333,576 | $105,000 | $228,576 |
| 2022 | $5,488 | $277,128 | $78,750 | $198,378 |
| 2021 | $4,191 | $176,721 | $56,875 | $119,846 |
| 2020 | $4,190 | $170,825 | $43,750 | $127,075 |
| 2019 | $3,680 | $145,876 | $35,000 | $110,876 |
| 2018 | $1,562 | $141,533 | $35,000 | $106,533 |
| 2017 | $3,467 | $137,596 | $35,000 | $102,596 |
| 2016 | $3,265 | $129,560 | $35,000 | $94,560 |
| 2015 | $2,481 | $124,027 | $35,000 | $89,027 |
| 2014 | $2,481 | $115,621 | $35,000 | $80,621 |
Source: Public Records
Map
Nearby Homes
- TBD Clayton St
- 504 Percival St Unit A
- 508 Clarence St
- 614 Percival St
- 109 Mcphail St
- 702 Clayton St
- 200 S Cherry St
- 701 Malone St
- 18818 Cornelia Fields Ln
- 18723 Buttercup Farms Ln
- 19935 Epona Creek Dr
- 18707 Buttercup Farms Ln
- 18826 Cornelia Fields Ln
- 712 Clarence St
- 204 Vernon St
- 0 N Sycamore St
- 200 S Vernon St
- TBD Mechanic St
- 0 Holiday St
- lt 19 Mechanic Rd
- 504 Clayton St
- 508 Clayton St
- 409 Florence St
- 510 Clayton St
- 412 S Pine St
- 501 Percival St
- 501 Clayton St
- 503 Clayton St
- 505 Clayton St
- 410 Florence St
- 507 Percival St
- 405 Florence St
- 410 Mcphail St
- 410 Mcphail St Unit B
- 410 Mcphail St Unit A
- 518 Clayton St
- 0 Percival St
- 515 Clayton St
- 406 Mc Phail St
- 310 S Pine St
Your Personal Tour Guide
Ask me questions while you tour the home.