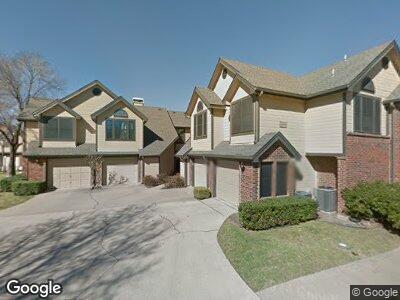
404 Santa fe Trail Unit 51E Irving, TX 75063
Valley Ranch NeighborhoodEstimated Value: $242,000 - $288,351
2
Beds
3
Baths
1,146
Sq Ft
$229/Sq Ft
Est. Value
About This Home
This home is located at 404 Santa fe Trail Unit 51E, Irving, TX 75063 and is currently estimated at $262,838, approximately $229 per square foot. 404 Santa fe Trail Unit 51E is a home located in Dallas County with nearby schools including Landry Elementary School, Bush Middle School, and Ranchview High School.
Ownership History
Date
Name
Owned For
Owner Type
Purchase Details
Closed on
Jun 8, 2016
Sold by
Judith A Zimmerman
Bought by
Zumbro Richard
Current Estimated Value
Home Financials for this Owner
Home Financials are based on the most recent Mortgage that was taken out on this home.
Original Mortgage
$146,105
Outstanding Balance
$118,176
Interest Rate
3.66%
Estimated Equity
$137,757
Purchase Details
Closed on
May 15, 2006
Sold by
Farabaugh John G
Bought by
Nikbeh Reza
Home Financials for this Owner
Home Financials are based on the most recent Mortgage that was taken out on this home.
Original Mortgage
$93,750
Interest Rate
6.4%
Mortgage Type
Stand Alone First
Purchase Details
Closed on
Feb 26, 2001
Sold by
Williams April A
Bought by
Farabaugh John G
Home Financials for this Owner
Home Financials are based on the most recent Mortgage that was taken out on this home.
Original Mortgage
$113,050
Interest Rate
6.97%
Create a Home Valuation Report for This Property
The Home Valuation Report is an in-depth analysis detailing your home's value as well as a comparison with similar homes in the area
Home Values in the Area
Average Home Value in this Area
Purchase History
| Date | Buyer | Sale Price | Title Company |
|---|---|---|---|
| Zumbro Richard | -- | -- | |
| Nikbeh Reza | -- | None Available | |
| Farabaugh John G | -- | -- |
Source: Public Records
Mortgage History
| Date | Status | Borrower | Loan Amount |
|---|---|---|---|
| Open | Farabaugh John G | $146,105 | |
| Closed | Farabaugh John G | -- | |
| Previous Owner | Nikbeh Reza | $93,750 | |
| Previous Owner | Nikbeh Reza | $18,750 | |
| Previous Owner | Farabaugh John G | $115,200 | |
| Previous Owner | Farabaugh John G | $113,050 |
Source: Public Records
Tax History Compared to Growth
Tax History
| Year | Tax Paid | Tax Assessment Tax Assessment Total Assessment is a certain percentage of the fair market value that is determined by local assessors to be the total taxable value of land and additions on the property. | Land | Improvement |
|---|---|---|---|---|
| 2023 | $1,527 | $183,360 | $49,840 | $133,520 |
| 2022 | $4,426 | $183,360 | $49,840 | $133,520 |
| 2021 | $4,057 | $160,000 | $16,610 | $143,390 |
| 2020 | $4,180 | $160,000 | $16,610 | $143,390 |
| 2019 | $4,342 | $158,150 | $16,610 | $141,540 |
| 2018 | $4,360 | $158,150 | $16,610 | $141,540 |
| 2017 | $1,526 | $158,150 | $16,610 | $141,540 |
| 2016 | $3,613 | $130,640 | $16,610 | $114,030 |
| 2015 | $2,722 | $127,210 | $16,610 | $110,600 |
| 2014 | $2,722 | $120,330 | $16,610 | $103,720 |
Source: Public Records
Map
Nearby Homes
- 100 Shinoak Valley
- 500 Button Willow Ct
- 209 Cimarron Trail Unit 6
- 322 Cimarron Trail
- 100 Black Rock Ct
- 600 Black Rock Ct
- 415 Pecos Trail
- 240 Harper St
- 615 Stone Canyon Dr
- 622 Stone Canyon Dr
- 701 Canal St
- 9005 Cumberland Dr
- 9000 Cumberland Dr
- 222 Woodson St
- 9902 Tolbert St
- 9404 Blue Jay Way
- 801 Spring Canyon Dr
- 9944 Hennings St
- 262 Jones St
- 9005 Crown Point Cir
- 418 Santa fe Trail Unit 114
- 406 Santa fe Trail Unit 48
- 414 Santa fe Trail Unit 96I
- 420 Santa fe Trail Unit 121L
- 422 Santa fe Trail Unit 11A
- 406 Santa fe Trail Unit 41D
- 420 Santa fe Trail Unit 123L
- 418 Santa fe Trail Unit 113K
- 408 Santa fe Trail Unit 61F
- 408 Santa fe Trail Unit 63F
- 404 Santa fe Trail Unit 51E
- 402 Santa fe Trail Unit 35C
- 406 Santa fe Trail Unit 47D
- 420 Santa fe Trail Unit 122L
- 422 Santa fe Trail Unit 12A
- 414 Santa fe Trail Unit 94I
- 406 Santa fe Trail Unit 46D
- 420 Santa fe Trail Unit 124
- 418 Santa fe Trail Unit 114
- 418 Santa fe Trail Unit 112K