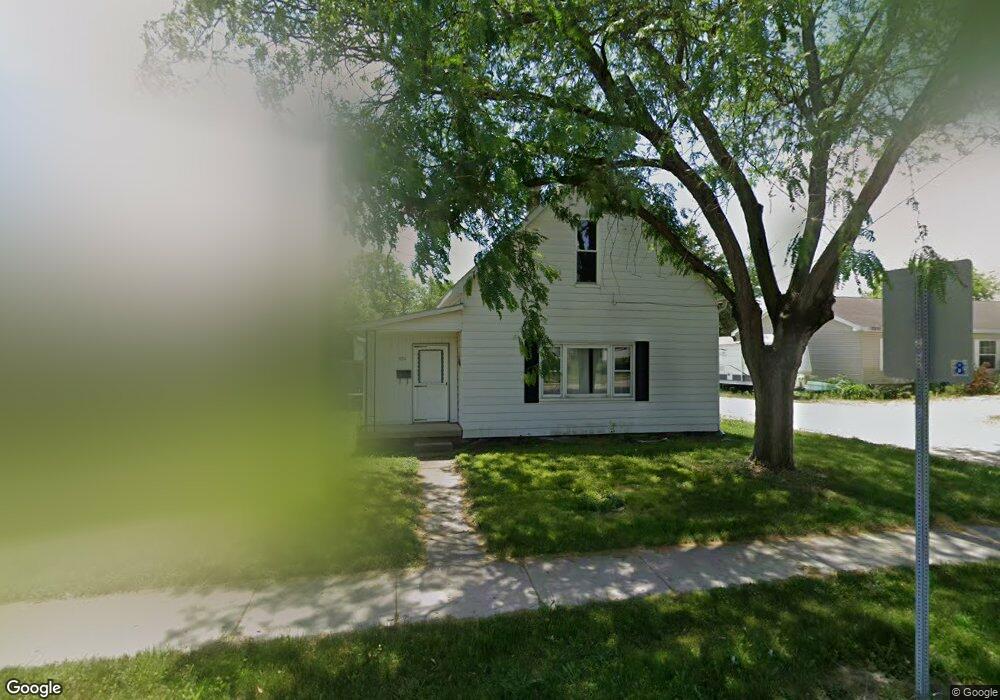
404 W 2nd St Sheridan, IN 46069
Estimated Value: $151,000 - $180,000
3
Beds
1
Bath
976
Sq Ft
$173/Sq Ft
Est. Value
About This Home
This home is located at 404 W 2nd St, Sheridan, IN 46069 and is currently estimated at $168,593, approximately $172 per square foot. 404 W 2nd St is a home located in Hamilton County with nearby schools including Sheridan Elementary School, Sheridan Middle School, and Sheridan High School.
Ownership History
Date
Name
Owned For
Owner Type
Purchase Details
Closed on
Oct 4, 2022
Sold by
Boone Grant
Bought by
State Of Indiana
Current Estimated Value
Purchase Details
Closed on
Apr 2, 2022
Sold by
Durbin Melinda L
Bought by
Signature Of Second
Purchase Details
Closed on
Apr 23, 2008
Sold by
The Bank Of New York Trust Co Na
Bought by
Durbin Melinda L
Purchase Details
Closed on
Nov 26, 2007
Sold by
Stowe Cathy S
Bought by
The Bank Of New York Trust Co Na
Create a Home Valuation Report for This Property
The Home Valuation Report is an in-depth analysis detailing your home's value as well as a comparison with similar homes in the area
Home Values in the Area
Average Home Value in this Area
Purchase History
| Date | Buyer | Sale Price | Title Company |
|---|---|---|---|
| State Of Indiana | $13,500 | None Listed On Document | |
| Signature Of Second | $75,000 | None Listed On Document | |
| Durbin Melinda L | -- | Resource Title Agency Inc | |
| The Bank Of New York Trust Co Na | $100,318 | None Available |
Source: Public Records
Tax History Compared to Growth
Tax History
| Year | Tax Paid | Tax Assessment Tax Assessment Total Assessment is a certain percentage of the fair market value that is determined by local assessors to be the total taxable value of land and additions on the property. | Land | Improvement |
|---|---|---|---|---|
| 2024 | $2,324 | $105,700 | $36,300 | $69,400 |
| 2023 | $2,349 | $103,300 | $36,300 | $67,000 |
| 2022 | $2,358 | $109,800 | $36,300 | $73,500 |
| 2021 | $2,352 | $103,400 | $36,300 | $67,100 |
| 2020 | $2,302 | $101,200 | $36,300 | $64,900 |
| 2019 | $2,120 | $93,100 | $15,200 | $77,900 |
| 2018 | $3,006 | $87,500 | $15,200 | $72,300 |
| 2017 | $2,827 | $80,700 | $15,200 | $65,500 |
| 2016 | $1,792 | $80,700 | $15,200 | $65,500 |
| 2014 | $1,451 | $66,500 | $16,600 | $49,900 |
| 2013 | $1,451 | $66,500 | $16,600 | $49,900 |
Source: Public Records
Map
Nearby Homes
- 514 E 2nd St
- 103 S Hudson St
- 400 S Georgia St
- 903&905 S Georgia St
- 600 S Georgia St
- 308 E 8th St
- Harmony Plan at Centre Place
- Stamford Plan at Centre Place
- Henley Plan at Centre Place
- Chatham Plan at Centre Place
- Holcombe Plan at Centre Place
- Aldridge Plan at Centre Place
- 390 W State Road 38
- 3191 W 246th St
- 3310 Godby Dr
- 405 W 3rd St
- 3310 Godby St
- 3369 Godby St
- 3328 Godby Dr
- 3352 Godby Dr