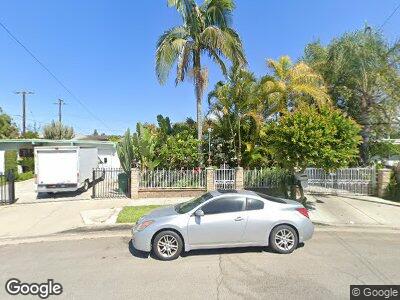
4043 Big Dalton Ave Baldwin Park, CA 91706
Estimated Value: $704,945 - $778,000
4
Beds
2
Baths
1,257
Sq Ft
$588/Sq Ft
Est. Value
About This Home
This home is located at 4043 Big Dalton Ave, Baldwin Park, CA 91706 and is currently estimated at $738,986, approximately $587 per square foot. 4043 Big Dalton Ave is a home located in Los Angeles County with nearby schools including Central Elementary, Charles D. Jones Junior High School, and Baldwin Park High School.
Ownership History
Date
Name
Owned For
Owner Type
Purchase Details
Closed on
May 13, 2016
Sold by
Dejesus Lopez Jose and Lopez Alma Marisa
Bought by
Lopez Jose De Jesus and Lopez Alma Marisa
Current Estimated Value
Home Financials for this Owner
Home Financials are based on the most recent Mortgage that was taken out on this home.
Original Mortgage
$121,000
Interest Rate
2.86%
Mortgage Type
New Conventional
Purchase Details
Closed on
Jun 5, 2000
Sold by
Meza Alma Marisa Cota
Bought by
Lopez Jose Dejesus
Home Financials for this Owner
Home Financials are based on the most recent Mortgage that was taken out on this home.
Original Mortgage
$150,350
Interest Rate
8.63%
Purchase Details
Closed on
May 9, 2000
Sold by
Flores Emilio and Flores Martha
Bought by
Lopez Jose Dejesus
Home Financials for this Owner
Home Financials are based on the most recent Mortgage that was taken out on this home.
Original Mortgage
$150,350
Interest Rate
8.63%
Create a Home Valuation Report for This Property
The Home Valuation Report is an in-depth analysis detailing your home's value as well as a comparison with similar homes in the area
Home Values in the Area
Average Home Value in this Area
Purchase History
| Date | Buyer | Sale Price | Title Company |
|---|---|---|---|
| Lopez Jose De Jesus | -- | First American Title Ins Co | |
| Lopez Jose Dejesus | -- | Commonwealth Title | |
| Lopez Jose Dejesus | $155,000 | Commonwealth Land Title |
Source: Public Records
Mortgage History
| Date | Status | Borrower | Loan Amount |
|---|---|---|---|
| Open | Lopez Jose De Jesus | $245,000 | |
| Closed | Dejesus Lopez Jose | $121,000 | |
| Closed | Lopez Jose Dejesus | $157,000 | |
| Previous Owner | Lopez Jose Dejesus | $150,350 |
Source: Public Records
Tax History Compared to Growth
Tax History
| Year | Tax Paid | Tax Assessment Tax Assessment Total Assessment is a certain percentage of the fair market value that is determined by local assessors to be the total taxable value of land and additions on the property. | Land | Improvement |
|---|---|---|---|---|
| 2024 | $3,213 | $228,958 | $123,934 | $105,024 |
| 2023 | $3,177 | $224,469 | $121,504 | $102,965 |
| 2022 | $3,226 | $220,069 | $119,122 | $100,947 |
| 2021 | $3,173 | $215,755 | $116,787 | $98,968 |
| 2019 | $2,988 | $209,358 | $113,324 | $96,034 |
| 2018 | $2,798 | $205,253 | $111,102 | $94,151 |
| 2016 | $2,627 | $197,285 | $106,789 | $90,496 |
| 2015 | $2,691 | $194,322 | $105,185 | $89,137 |
| 2014 | $2,658 | $190,516 | $103,125 | $87,391 |
Source: Public Records
Map
Nearby Homes
- 14740 Palmera Ct
- 15134 Navilla Place
- 2131 W San Bernardino Rd Unit 46
- 14730 Clark St
- 14517 Jeremie St
- 601 N Morris Ave
- 14621 1/2 Clark St
- 4322 Bogart Ave
- 14616 Los Angeles St
- 4015 N Conlon Ave
- 434 N Orange Ave
- 4142 N Nora Ave
- 653 Park Shadow Ct
- 504 Park Shadow Ct
- 2329 W Channing St
- 14412 Hallwood Dr
- 3517 Big Dalton Ave
- 133 Victoria Ave
- 4668 Maine Ave
- 3934 N Irwindale Ave
- 4043 Big Dalton Ave
- 4047 Big Dalton Ave
- 4037 Big Dalton Ave
- 4051 Big Dalton Ave
- 4057 Puente Ave
- 4037 Puente Ave
- 4027 Big Dalton Ave
- 4063 Puente Ave
- 4031 Puente Ave
- 4024 Big Dalton Ave
- 4021 Big Dalton Ave
- 4025 Puente Ave
- 4060 Puente Ave Unit A
- 4015 Big Dalton Ave
- 4018 Big Dalton Ave
- 4019 Puente Ave
- 15102 Badillo St
- 0 Badillo St
- 4028 Puente Ave
- 15000 Badillo St