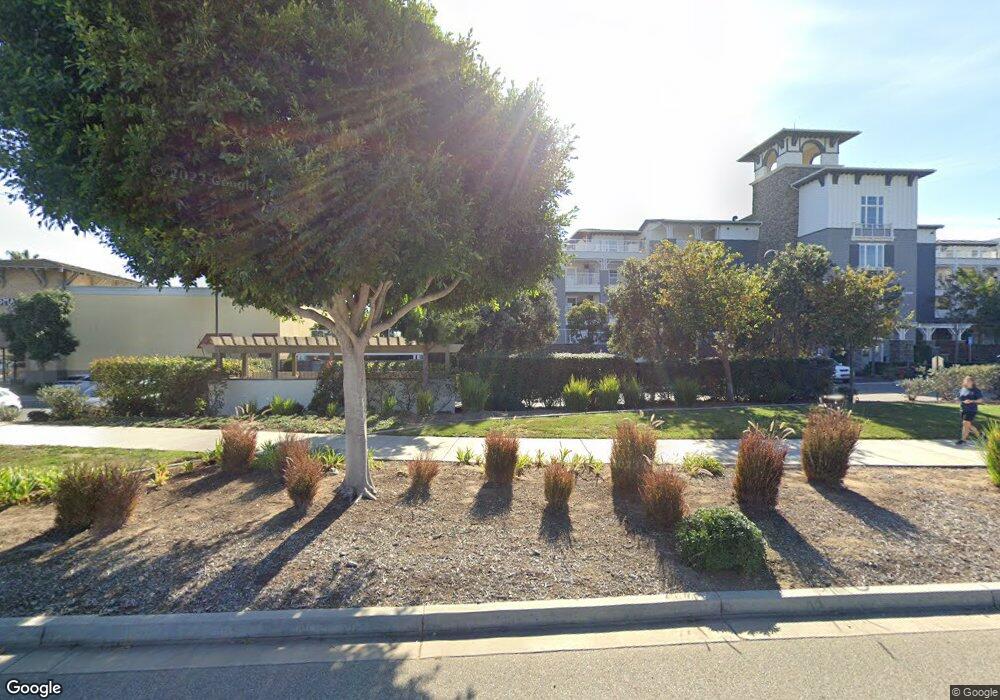
4046 Tradewinds Dr Unit 310 Oxnard, CA 93035
Channel Islands NeighborhoodEstimated Value: $991,068 - $1,230,000
2
Beds
2
Baths
1,700
Sq Ft
$626/Sq Ft
Est. Value
About This Home
This home is located at 4046 Tradewinds Dr Unit 310, Oxnard, CA 93035 and is currently estimated at $1,064,017, approximately $625 per square foot. 4046 Tradewinds Dr Unit 310 is a home located in Ventura County with nearby schools including Christa Mcauliffe Elementary School and Oxnard High School.
Ownership History
Date
Name
Owned For
Owner Type
Purchase Details
Closed on
Jan 29, 2021
Sold by
Gilmer Elaine Koyama
Bought by
Gilmer Elaine Koyama and Elaine Koyama Gilmer Trust
Current Estimated Value
Home Financials for this Owner
Home Financials are based on the most recent Mortgage that was taken out on this home.
Original Mortgage
$593,000
Outstanding Balance
$529,453
Interest Rate
2.6%
Mortgage Type
Purchase Money Mortgage
Estimated Equity
$534,564
Purchase Details
Closed on
Jun 18, 2018
Sold by
Rabinoff Lawrence
Bought by
Gilmer Elaine Koyama and Elaine Koyama Gilmer Trust
Home Financials for this Owner
Home Financials are based on the most recent Mortgage that was taken out on this home.
Original Mortgage
$623,000
Interest Rate
2.99%
Mortgage Type
Adjustable Rate Mortgage/ARM
Purchase Details
Closed on
Dec 12, 2017
Sold by
Port Marluna Llc
Bought by
Rabinoff Lawrence
Home Financials for this Owner
Home Financials are based on the most recent Mortgage that was taken out on this home.
Original Mortgage
$721,928
Interest Rate
3.94%
Mortgage Type
New Conventional
Create a Home Valuation Report for This Property
The Home Valuation Report is an in-depth analysis detailing your home's value as well as a comparison with similar homes in the area
Home Values in the Area
Average Home Value in this Area
Purchase History
| Date | Buyer | Sale Price | Title Company |
|---|---|---|---|
| Gilmer Elaine Koyama | -- | Accommodation | |
| Gilmer Elaine Koyama | -- | Fidelity National Title Co | |
| Gilmer Elaine Koyama | $890,000 | Chicago Title Co | |
| Rabinoff Lawrence | $902,500 | Chicago Title Co |
Source: Public Records
Mortgage History
| Date | Status | Borrower | Loan Amount |
|---|---|---|---|
| Open | Gilmer Elaine Koyama | $593,000 | |
| Previous Owner | Gilmer Elaine Koyama | $623,000 | |
| Previous Owner | Rabinoff Lawrence | $721,928 |
Source: Public Records
Tax History
| Year | Tax Paid | Tax Assessment Tax Assessment Total Assessment is a certain percentage of the fair market value that is determined by local assessors to be the total taxable value of land and additions on the property. | Land | Improvement |
|---|---|---|---|---|
| 2025 | $15,501 | $992,808 | $645,327 | $347,481 |
| 2024 | $15,501 | $973,342 | $632,674 | $340,668 |
| 2023 | $15,056 | $954,257 | $620,268 | $333,989 |
| 2022 | $14,262 | $935,547 | $608,106 | $327,441 |
| 2021 | $13,980 | $917,203 | $596,182 | $321,021 |
| 2020 | $13,795 | $907,800 | $590,070 | $317,730 |
| 2019 | $14,138 | $890,000 | $578,500 | $311,500 |
| 2018 | $8,514 | $387,405 | $125,732 | $261,673 |
| 2017 | $7,258 | $295,045 | $123,267 | $171,778 |
Source: Public Records
Map
Nearby Homes
- 4060 Tradewinds Dr
- 1437 Windshore Way
- 1423 Caspian Way
- 1365 Donegal Way
- 1421 Windshore Way
- 1423 Windshore Way
- 3800 Alee Ln
- 4234 Tradewinds Dr
- 1506 Seabridge Ln
- 1503 Windshore Way
- 1541 Windshore Way
- 4312 Waterside Ln
- 4114 Caribbean St
- 4320 Waterside Ln
- 4344 Tradewinds Dr
- 1464 Twin Tides Place
- 1520 Viewpoint Dr
- 4073 Galapagos Way
- 1758 Emerald Isle Way
- 4045 Harbour Island Ln
- 4046 Tradewinds Dr
- 4024 Tradewinds Dr
- 4002 Tradewinds Dr
- 4002 Tradewinds Dr Unit 102
- 4000 Tradewinds Dr Unit 111
- 4022 Tradewinds Dr Unit 211
- 4022 Tradewinds Dr Unit 201
- 4000 Tradewinds Dr Unit 101
- 4022 Tradewinds Dr
- 4000 Tradewinds Dr
- 4004 Tradewinds Dr Unit 109
- 4004 Tradewinds Dr Unit 103
- 4004 Tradewinds Dr
- 4004 Tradewinds Dr
- 4026 Tradewinds Dr Unit 209
- 4066 Tradewinds Dr Unit 409
- 4066 Tradewinds Dr Unit 401
- 4026 Tradewinds Dr
- 4066 Tradewinds Dr
- 4044 Tradewinds Dr Unit 311
Your Personal Tour Guide
Ask me questions while you tour the home.