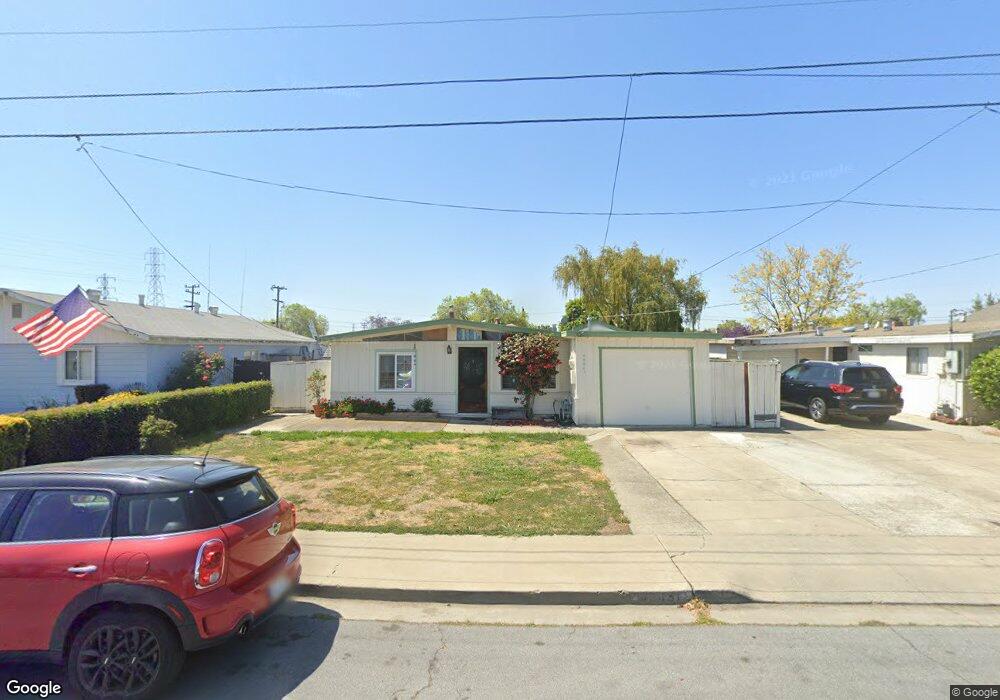
40461 Foster St Fremont, CA 94538
Sundale NeighborhoodEstimated Value: $1,052,000 - $1,282,000
3
Beds
2
Baths
1,073
Sq Ft
$1,044/Sq Ft
Est. Value
About This Home
This home is located at 40461 Foster St, Fremont, CA 94538 and is currently estimated at $1,120,244, approximately $1,044 per square foot. 40461 Foster St is a home located in Alameda County with nearby schools including John Blacow Elementary School, G.M. Walters Middle School, and John F. Kennedy High School.
Ownership History
Date
Name
Owned For
Owner Type
Purchase Details
Closed on
Aug 24, 2009
Sold by
Tran Huong Thien Thi
Bought by
Do Trang Tan
Current Estimated Value
Home Financials for this Owner
Home Financials are based on the most recent Mortgage that was taken out on this home.
Original Mortgage
$205,000
Interest Rate
5.09%
Mortgage Type
New Conventional
Purchase Details
Closed on
Aug 30, 1999
Sold by
Chrisp Mark J and Chrisp Jackie
Bought by
Do Trang Tan
Home Financials for this Owner
Home Financials are based on the most recent Mortgage that was taken out on this home.
Original Mortgage
$188,000
Interest Rate
7.47%
Mortgage Type
Stand Alone First
Purchase Details
Closed on
Jan 10, 1997
Sold by
Scheuermann Trina A
Bought by
Chrisp Mark James and Chrisp Jackie
Home Financials for this Owner
Home Financials are based on the most recent Mortgage that was taken out on this home.
Original Mortgage
$160,946
Interest Rate
7.46%
Mortgage Type
FHA
Create a Home Valuation Report for This Property
The Home Valuation Report is an in-depth analysis detailing your home's value as well as a comparison with similar homes in the area
Home Values in the Area
Average Home Value in this Area
Purchase History
| Date | Buyer | Sale Price | Title Company |
|---|---|---|---|
| Do Trang Tan | -- | Chicago Title Company | |
| Do Trang Tan | $235,000 | Nortwestern Title Company | |
| Chrisp Mark James | $164,000 | Fidelity National Title Co |
Source: Public Records
Mortgage History
| Date | Status | Borrower | Loan Amount |
|---|---|---|---|
| Closed | Do Trang Tan | $205,000 | |
| Closed | Do Trang Tan | $188,000 | |
| Previous Owner | Chrisp Mark James | $160,946 |
Source: Public Records
Tax History Compared to Growth
Tax History
| Year | Tax Paid | Tax Assessment Tax Assessment Total Assessment is a certain percentage of the fair market value that is determined by local assessors to be the total taxable value of land and additions on the property. | Land | Improvement |
|---|---|---|---|---|
| 2025 | $5,000 | $375,865 | $108,350 | $274,515 |
| 2024 | $5,000 | $368,359 | $106,226 | $269,133 |
| 2023 | $4,852 | $368,001 | $104,144 | $263,857 |
| 2022 | $4,771 | $353,786 | $102,102 | $258,684 |
| 2021 | $4,658 | $346,713 | $100,100 | $253,613 |
| 2020 | $4,612 | $350,089 | $99,075 | $251,014 |
| 2019 | $4,562 | $343,225 | $97,132 | $246,093 |
| 2018 | $4,470 | $336,497 | $95,228 | $241,269 |
| 2017 | $4,358 | $329,900 | $93,361 | $236,539 |
| 2016 | $4,274 | $323,433 | $91,531 | $231,902 |
| 2015 | $4,207 | $318,575 | $90,156 | $228,419 |
| 2014 | $4,128 | $312,335 | $88,390 | $223,945 |
Source: Public Records
Map
Nearby Homes
- 40702 Greystone Terrace Unit 9
- 4214 Providence Terrace
- 4310 Providence Terrace
- 40708 Fremont Blvd
- 4421 Cahill St
- 40769 Squill Common
- 4463 Hyde Common Unit 306
- 4453 Porter St
- 40469 Shaw Ct
- 39993 Fremont Blvd Unit 102
- 3909 Stevenson Blvd Unit 402
- 40116 Crockett St
- 40425 Chapel Way Unit 214
- 40425 Chapel Way Unit 309
- 3695 Stevenson Blvd Unit E206
- 4555 Stevenson Blvd
- 41212 Fremont Blvd
- 40696 Robin St
- 3583 Madison Common
- 3518 Madison Common
- 40453 Foster St
- 40469 Foster St
- 40445 Foster St
- 40464 Marcia St
- 40477 Foster St
- 40458 Marcia St
- 40472 Marcia St
- 40450 Marcia St
- 40464 Foster St
- 40437 Foster St
- 40480 Marcia St
- 40472 Foster St
- 40456 Foster St
- 40442 Marcia St
- 40480 Foster St
- 40448 Foster St
- 40429 Foster St
- 40440 Foster St
- 40434 Marcia St
- 4152 Eugene St