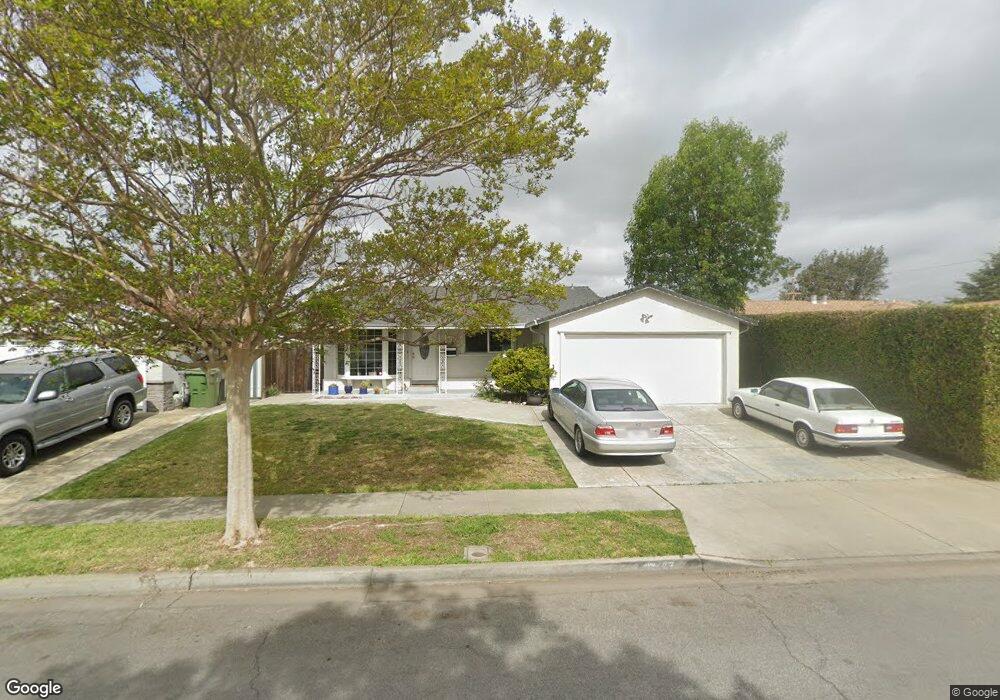
40467 Verne St Fremont, CA 94538
Sundale NeighborhoodEstimated Value: $1,331,697 - $1,442,000
3
Beds
2
Baths
1,158
Sq Ft
$1,202/Sq Ft
Est. Value
About This Home
This home is located at 40467 Verne St, Fremont, CA 94538 and is currently estimated at $1,392,174, approximately $1,202 per square foot. 40467 Verne St is a home located in Alameda County with nearby schools including John Blacow Elementary School, G.M. Walters Middle School, and John F. Kennedy High School.
Ownership History
Date
Name
Owned For
Owner Type
Purchase Details
Closed on
May 21, 2010
Sold by
Duarte Sheila Olivia and Caro Felix
Bought by
Kwei Jack
Current Estimated Value
Purchase Details
Closed on
Jun 19, 2007
Sold by
Caro Felix
Bought by
Duarte Sheila Olivia and Caro Felix
Home Financials for this Owner
Home Financials are based on the most recent Mortgage that was taken out on this home.
Original Mortgage
$416,000
Interest Rate
5.87%
Mortgage Type
Purchase Money Mortgage
Purchase Details
Closed on
Jun 6, 2007
Sold by
Duarte Sheila Olivia and Caro Felix
Bought by
Caro Felix
Home Financials for this Owner
Home Financials are based on the most recent Mortgage that was taken out on this home.
Original Mortgage
$416,000
Interest Rate
5.87%
Mortgage Type
Purchase Money Mortgage
Purchase Details
Closed on
Jan 5, 2007
Sold by
Duarte Sheila Olivia
Bought by
Durate Sheila Olivia and Caro Felix
Purchase Details
Closed on
Jun 4, 1996
Sold by
Grantham Cecile
Bought by
Grantham Cecile and 1996 Revocable Living Tr Cecil
Create a Home Valuation Report for This Property
The Home Valuation Report is an in-depth analysis detailing your home's value as well as a comparison with similar homes in the area
Home Values in the Area
Average Home Value in this Area
Purchase History
| Date | Buyer | Sale Price | Title Company |
|---|---|---|---|
| Kwei Jack | $428,500 | Fidelity National Title Co | |
| Duarte Sheila Olivia | -- | None Available | |
| Caro Felix | $139,000 | New Century Title Company | |
| Durate Sheila Olivia | -- | None Available | |
| Duarte Sheila Olivia | -- | None Available | |
| Grantham Cecile | -- | -- |
Source: Public Records
Mortgage History
| Date | Status | Borrower | Loan Amount |
|---|---|---|---|
| Previous Owner | Caro Felix | $416,000 |
Source: Public Records
Tax History Compared to Growth
Tax History
| Year | Tax Paid | Tax Assessment Tax Assessment Total Assessment is a certain percentage of the fair market value that is determined by local assessors to be the total taxable value of land and additions on the property. | Land | Improvement |
|---|---|---|---|---|
| 2025 | $6,963 | $552,560 | $165,729 | $386,831 |
| 2024 | $6,963 | $541,730 | $162,481 | $379,249 |
| 2023 | $6,770 | $531,108 | $159,295 | $371,813 |
| 2022 | $6,672 | $520,697 | $156,172 | $364,525 |
| 2021 | $6,512 | $510,491 | $153,111 | $357,380 |
| 2020 | $6,495 | $505,259 | $151,542 | $353,717 |
| 2019 | $6,423 | $495,353 | $148,571 | $346,782 |
| 2018 | $6,298 | $485,644 | $145,659 | $339,985 |
| 2017 | $6,141 | $476,123 | $142,803 | $333,320 |
| 2016 | $6,032 | $466,790 | $140,004 | $326,786 |
| 2015 | $5,947 | $459,782 | $137,902 | $321,880 |
| 2014 | $5,842 | $450,780 | $135,202 | $315,578 |
Source: Public Records
Map
Nearby Homes
- 4744 Bach Ct
- 5149 Roycroft Way
- 4572 De Silva St
- 40803 Blacow Rd
- 4759 Stevenson Blvd
- 4751 Wadsworth Ct
- 4619 Victoria Ave
- 5341 Audubon Park Ct
- 40696 Robin St
- 5531 Cosmos Common Unit 116
- 5624 Chestnut Common
- 5580 Hemlock Terrace
- 4453 Porter St
- 105 Visa Ct
- 4421 Cahill St
- 4860 Bryce Canyon Park Dr
- 4350 Millard Ave
- 4537 Capewood Terrace
- 4533 Capewood Terrace
- 4692 Nelson St