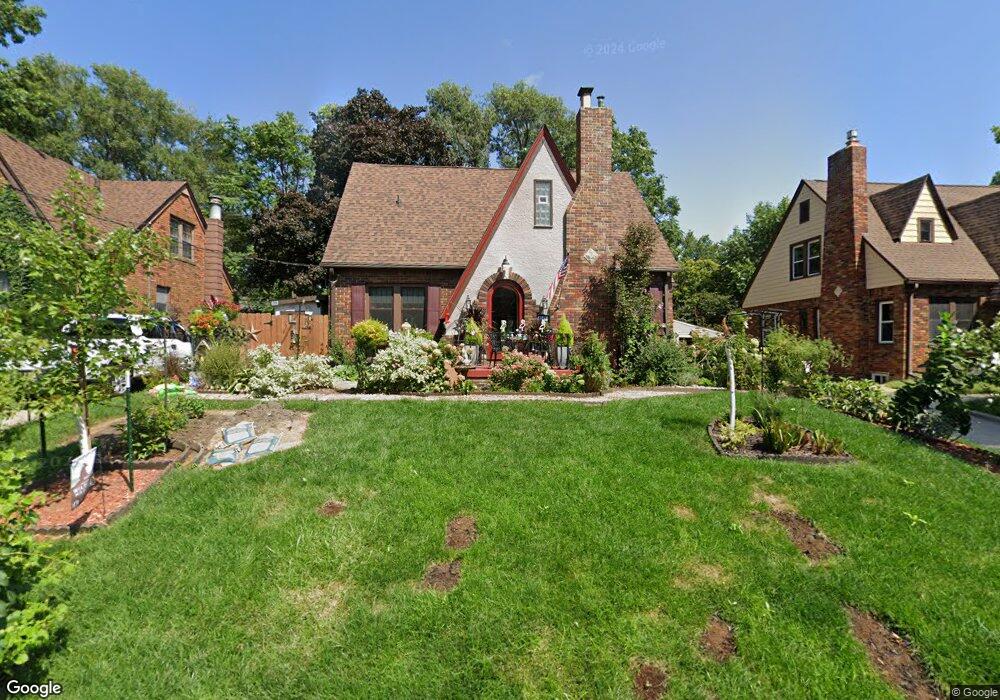
4047 Ashby Ave Des Moines, IA 50310
Beaverdale NeighborhoodEstimated Value: $360,572 - $411,000
3
Beds
2
Baths
2,243
Sq Ft
$171/Sq Ft
Est. Value
About This Home
This home is located at 4047 Ashby Ave, Des Moines, IA 50310 and is currently estimated at $383,893, approximately $171 per square foot. 4047 Ashby Ave is a home located in Polk County with nearby schools including Moore Elementary School, Meredith Middle School, and Hoover High School.
Ownership History
Date
Name
Owned For
Owner Type
Purchase Details
Closed on
May 27, 2021
Sold by
Strix Varia Llc
Bought by
Cyran Christopher R and Zinggeler Kimberly J
Current Estimated Value
Home Financials for this Owner
Home Financials are based on the most recent Mortgage that was taken out on this home.
Original Mortgage
$211,000
Outstanding Balance
$190,618
Interest Rate
2.9%
Mortgage Type
New Conventional
Estimated Equity
$193,275
Purchase Details
Closed on
Oct 15, 2019
Sold by
Thorup Joan R and Thorup Thomas L
Bought by
Strix Varia Llc
Purchase Details
Closed on
Sep 12, 2018
Sold by
Thorup Joan R
Bought by
Thorup Joan R
Purchase Details
Closed on
Sep 27, 2013
Sold by
Thorup Joan Ruth and Thorup Thomas L
Bought by
Thorup Joan Ruth and Thorup Thomas L
Home Financials for this Owner
Home Financials are based on the most recent Mortgage that was taken out on this home.
Original Mortgage
$16,163
Interest Rate
4.56%
Mortgage Type
Purchase Money Mortgage
Create a Home Valuation Report for This Property
The Home Valuation Report is an in-depth analysis detailing your home's value as well as a comparison with similar homes in the area
Home Values in the Area
Average Home Value in this Area
Purchase History
| Date | Buyer | Sale Price | Title Company |
|---|---|---|---|
| Cyran Christopher R | $301,000 | None Available | |
| Strix Varia Llc | $162,000 | None Available | |
| Thorup Joan R | -- | None Available | |
| Thorup Joan Ruth | -- | None Available |
Source: Public Records
Mortgage History
| Date | Status | Borrower | Loan Amount |
|---|---|---|---|
| Open | Cyran Christopher R | $211,000 | |
| Previous Owner | Thorup Joan Ruth | $16,163 |
Source: Public Records
Tax History Compared to Growth
Tax History
| Year | Tax Paid | Tax Assessment Tax Assessment Total Assessment is a certain percentage of the fair market value that is determined by local assessors to be the total taxable value of land and additions on the property. | Land | Improvement |
|---|---|---|---|---|
| 2025 | $6,720 | $385,100 | $49,900 | $335,200 |
| 2024 | $6,720 | $341,600 | $44,300 | $297,300 |
| 2023 | $6,884 | $341,600 | $44,300 | $297,300 |
| 2022 | $3,680 | $292,100 | $39,100 | $253,000 |
| 2021 | $5,382 | $157,300 | $31,300 | $126,000 |
| 2020 | $5,364 | $215,700 | $36,500 | $179,200 |
| 2019 | $5,058 | $215,700 | $36,500 | $179,200 |
| 2018 | $5,000 | $196,700 | $32,400 | $164,300 |
| 2017 | $4,554 | $196,700 | $32,400 | $164,300 |
| 2016 | $4,432 | $176,900 | $28,700 | $148,200 |
| 2015 | $4,432 | $176,900 | $28,700 | $148,200 |
| 2014 | $4,188 | $172,500 | $27,300 | $145,200 |
Source: Public Records
Map
Nearby Homes
- 3112 Beaver Ave
- 4037 Amick Ave
- 4004 Clinton Ave
- 3215 44th St
- 4008 Douglas Ave
- 4020 Douglas Ave
- 3905 Clinton Ave
- 3711 Adams Ave
- 4415 Amick Ave
- 3117 45th St
- 4425 Amick Ave
- 3605 Davisson Rd
- 3616 37th St
- 4507 Amick Ave
- 3514 Davisson Rd
- 3831 40th St
- 3711 37th St
- 3403 47th St
- 4327 Sheridan Ave
- 2614 40th Place