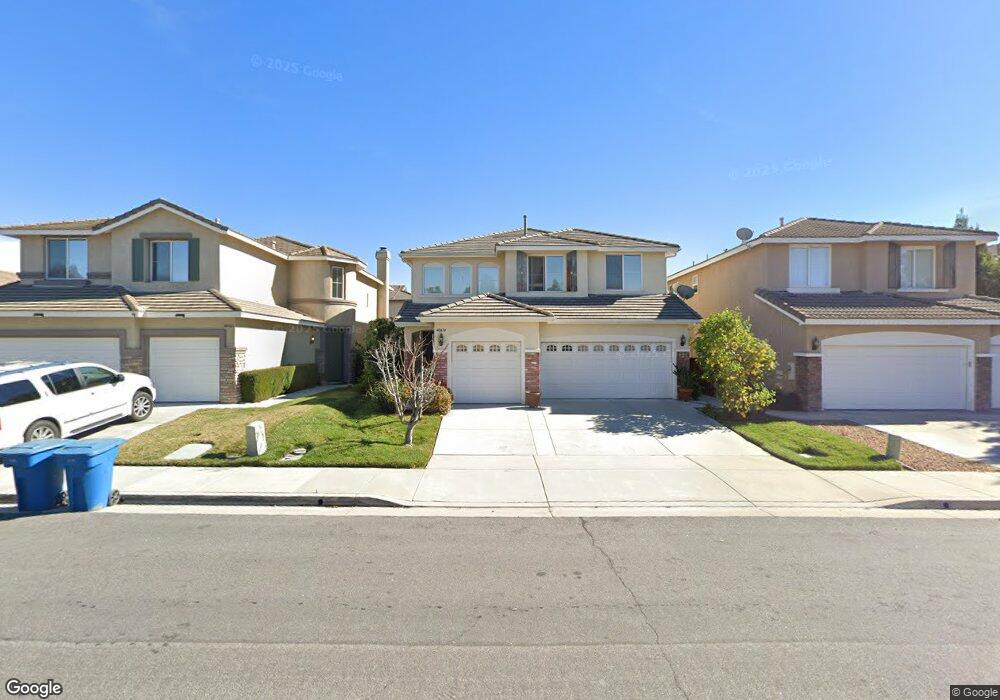
40474 Chantemar Way Temecula, CA 92591
Meadowview NeighborhoodEstimated Value: $664,000 - $790,000
5
Beds
3
Baths
2,427
Sq Ft
$305/Sq Ft
Est. Value
About This Home
This home is located at 40474 Chantemar Way, Temecula, CA 92591 and is currently estimated at $739,591, approximately $304 per square foot. 40474 Chantemar Way is a home located in Riverside County with nearby schools including Nicolas Valley Elementary School, James L. Day Middle School, and Chaparral High School.
Ownership History
Date
Name
Owned For
Owner Type
Purchase Details
Closed on
Aug 29, 2007
Sold by
Calkins Debbie R Redden
Bought by
Clift Robert S and Clift Bruna
Current Estimated Value
Purchase Details
Closed on
Apr 25, 2007
Sold by
Calkins Debbie R Redden and Redden Brunello Debbie R
Bought by
Calkins Debbie R Redden and Calkins Living Trust
Purchase Details
Closed on
Jan 8, 2003
Sold by
Redden Brunello Debbie R
Bought by
Redden Brunello Debbie R
Home Financials for this Owner
Home Financials are based on the most recent Mortgage that was taken out on this home.
Original Mortgage
$225,000
Interest Rate
5.93%
Purchase Details
Closed on
Nov 15, 2001
Sold by
Brunello Stephen A
Bought by
Redden Brunello Debbie R
Purchase Details
Closed on
Nov 14, 2000
Sold by
Woodside Chantemar Inc
Bought by
Redden Brunello Debbie R
Home Financials for this Owner
Home Financials are based on the most recent Mortgage that was taken out on this home.
Original Mortgage
$204,250
Interest Rate
7.08%
Create a Home Valuation Report for This Property
The Home Valuation Report is an in-depth analysis detailing your home's value as well as a comparison with similar homes in the area
Home Values in the Area
Average Home Value in this Area
Purchase History
| Date | Buyer | Sale Price | Title Company |
|---|---|---|---|
| Clift Robert S | $415,000 | None Available | |
| Calkins Debbie R Redden | -- | None Available | |
| Redden Brunello Debbie R | -- | American Title | |
| Redden Brunello Debbie R | -- | First American Title Co | |
| Redden Brunello Debbie R | $240,500 | First American Title Co |
Source: Public Records
Mortgage History
| Date | Status | Borrower | Loan Amount |
|---|---|---|---|
| Previous Owner | Redden Brunello Debbie R | $225,000 | |
| Previous Owner | Redden Brunello Debbie R | $204,250 |
Source: Public Records
Tax History
| Year | Tax Paid | Tax Assessment Tax Assessment Total Assessment is a certain percentage of the fair market value that is determined by local assessors to be the total taxable value of land and additions on the property. | Land | Improvement |
|---|---|---|---|---|
| 2025 | $6,602 | $545,087 | $157,609 | $387,478 |
| 2023 | $6,602 | $523,923 | $151,490 | $372,433 |
| 2022 | $6,402 | $513,651 | $148,520 | $365,131 |
| 2021 | $6,272 | $503,580 | $145,608 | $357,972 |
| 2020 | $6,031 | $483,111 | $139,256 | $343,855 |
| 2019 | $5,890 | $469,040 | $135,200 | $333,840 |
| 2018 | $5,677 | $451,000 | $130,000 | $321,000 |
| 2017 | $5,462 | $432,000 | $125,000 | $307,000 |
| 2016 | $5,216 | $411,000 | $119,000 | $292,000 |
| 2015 | $4,662 | $364,000 | $105,000 | $259,000 |
| 2014 | $4,562 | $360,000 | $104,000 | $256,000 |
Source: Public Records
Map
Nearby Homes
- 40591 Chantemar Way
- 27590 Nellie Ct
- 40243 Mimulus Way
- 27536 Swallow Ct
- 27546 Senna Ct
- 29049 Portland Ct
- 41070 Avenida Verde
- 28745 Edenton Way
- 29928 Valle Olvera
- 41480 Luz Del Sol
- 39560 Linnit Cir
- 30041 Los Nogales Rd
- 40265 Danbury Ct
- 28550 Via Prago
- 39785 Knollridge Dr
- 28848 Laurel Ln
- 28389 Via Solero
- 28500 Via Priorat
- 29579 Cara Way
- 28291 Via Garnicia
- 40482 Chantemar Way
- 40466 Chantemar Way
- 40458 Chantemar Way
- 40488 Chantemar Way
- 40450 Chantemar Way
- 27684 Sonora Cir
- 40498 Chantemar Way
- 27691 Sonora Cir
- 40469 Chantemar Way
- 40461 Chantemar Way
- 40477 Chantemar Way
- 40444 Chantemar Way
- 40508 Chantemar Way
- 40453 Chantemar Way
- 27685 Sonora Cir
- 40485 Chantemar Way
- 27672 Sonora Cir
- 27679 Sonora Cir
- 40434 Chantemar Way
- 40493 Chantemar Way
Your Personal Tour Guide
Ask me questions while you tour the home.