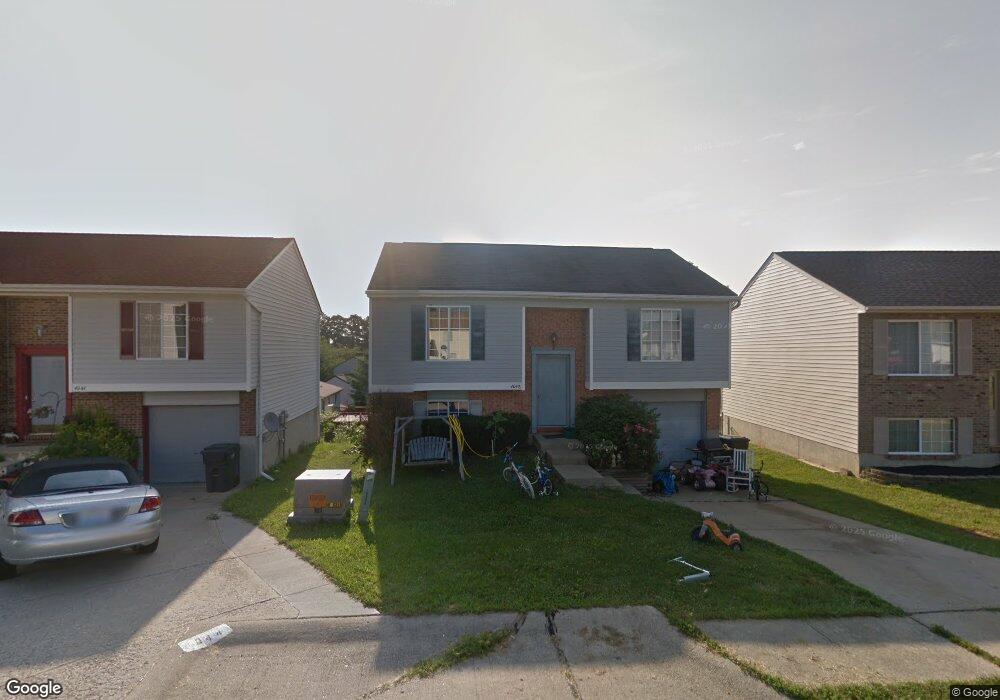
4048 Summerwood Ct Erlanger, KY 41018
Estimated Value: $227,000 - $249,000
3
Beds
2
Baths
816
Sq Ft
$291/Sq Ft
Est. Value
About This Home
This home is located at 4048 Summerwood Ct, Erlanger, KY 41018 and is currently estimated at $237,090, approximately $290 per square foot. 4048 Summerwood Ct is a home located in Kenton County with nearby schools including Caywood Elementary School, Dixie Heights High School, and Mary, Queen of Heaven School.
Ownership History
Date
Name
Owned For
Owner Type
Purchase Details
Closed on
Jan 26, 2006
Sold by
Vanlandingham Steven W and Vanlandingham Theresa A
Bought by
D & L Rental Properties Iii Llc
Current Estimated Value
Home Financials for this Owner
Home Financials are based on the most recent Mortgage that was taken out on this home.
Original Mortgage
$99,900
Outstanding Balance
$56,273
Interest Rate
6.21%
Mortgage Type
Purchase Money Mortgage
Estimated Equity
$180,817
Purchase Details
Closed on
May 15, 2001
Sold by
Clore Stanley M
Bought by
Vanlandingham Steve W and Vanlandingham Theresa A
Home Financials for this Owner
Home Financials are based on the most recent Mortgage that was taken out on this home.
Original Mortgage
$50,000
Interest Rate
6.95%
Mortgage Type
New Conventional
Purchase Details
Closed on
Jan 8, 1997
Sold by
Bbhm Inc
Bought by
Clore Stanley M
Home Financials for this Owner
Home Financials are based on the most recent Mortgage that was taken out on this home.
Original Mortgage
$77,556
Interest Rate
7.53%
Mortgage Type
FHA
Create a Home Valuation Report for This Property
The Home Valuation Report is an in-depth analysis detailing your home's value as well as a comparison with similar homes in the area
Home Values in the Area
Average Home Value in this Area
Purchase History
| Date | Buyer | Sale Price | Title Company |
|---|---|---|---|
| D & L Rental Properties Iii Llc | $111,000 | None Available | |
| Vanlandingham Steve W | $94,000 | -- | |
| Clore Stanley M | $77,500 | -- |
Source: Public Records
Mortgage History
| Date | Status | Borrower | Loan Amount |
|---|---|---|---|
| Open | D & L Rental Properties Iii Llc | $99,900 | |
| Previous Owner | Vanlandingham Steve W | $50,000 | |
| Previous Owner | Clore Stanley M | $77,556 |
Source: Public Records
Tax History Compared to Growth
Tax History
| Year | Tax Paid | Tax Assessment Tax Assessment Total Assessment is a certain percentage of the fair market value that is determined by local assessors to be the total taxable value of land and additions on the property. | Land | Improvement |
|---|---|---|---|---|
| 2024 | $1,933 | $188,600 | $25,000 | $163,600 |
| 2023 | $2,010 | $188,600 | $25,000 | $163,600 |
| 2022 | $1,332 | $117,500 | $20,000 | $97,500 |
| 2021 | $1,360 | $117,500 | $20,000 | $97,500 |
| 2020 | $1,373 | $117,500 | $20,000 | $97,500 |
| 2019 | $1,378 | $117,500 | $20,000 | $97,500 |
| 2018 | $1,309 | $111,000 | $20,000 | $91,000 |
| 2017 | $1,199 | $111,000 | $20,000 | $91,000 |
| 2015 | $1,166 | $111,000 | $20,000 | $91,000 |
| 2014 | $1,146 | $111,000 | $20,000 | $91,000 |
Source: Public Records
Map
Nearby Homes
- 4014 List Ct
- NAPLES Plan at Southwick - The Villas
- HIALEAH Plan at Southwick - The Villas
- SARASOTA Plan at Southwick - The Villas
- BEACHWOOD Plan at Southwick - The Villas
- KENAI Plan at Southwick - The Villas
- BOULDER Plan at Southwick - The Villas
- MCKENZIE Plan at Southwick - The Villas
- YAKIMA Plan at Southwick - The Villas
- ALEXANDER Plan at Southwick - The Villas
- HOLSTON Plan at Southwick - The Villas
- 1222 Lynn Haven Way
- 3912 Brunswick Ct
- 3947 Ashmont Dr
- 811 Rudolph Way
- 877 Ashridge Ct
- 913 Summitridge Ln Unit 118B
- 4071 Elizabeth Dr
- 904 Ashridge Ct
- 4079 Elizabeth Dr
- 4052 Summerwood Ct
- 4044 Summerwood Ct
- 4093 Circlewood Dr
- 4056 Summerwood Ct
- 4040 Summerwood Ct
- 4039 Summerwood Ct
- 3916 Woodchase Dr
- 4095 Circlewood Dr
- 4056 Heartwood Ln
- 4052 Heartwood Ln
- 3920 Woodchase Dr
- 3907 Woodchase Dr
- 4097 Circlewood Dr
- 3924 Woodchase Dr
- 3971 Woodchase Dr
- 4090 Circlewood Dr
- 4092 Circlewood Dr
- 4088 Circlewood Dr
- 3911 Woodchase Dr
- 4081 Woodchase Dr