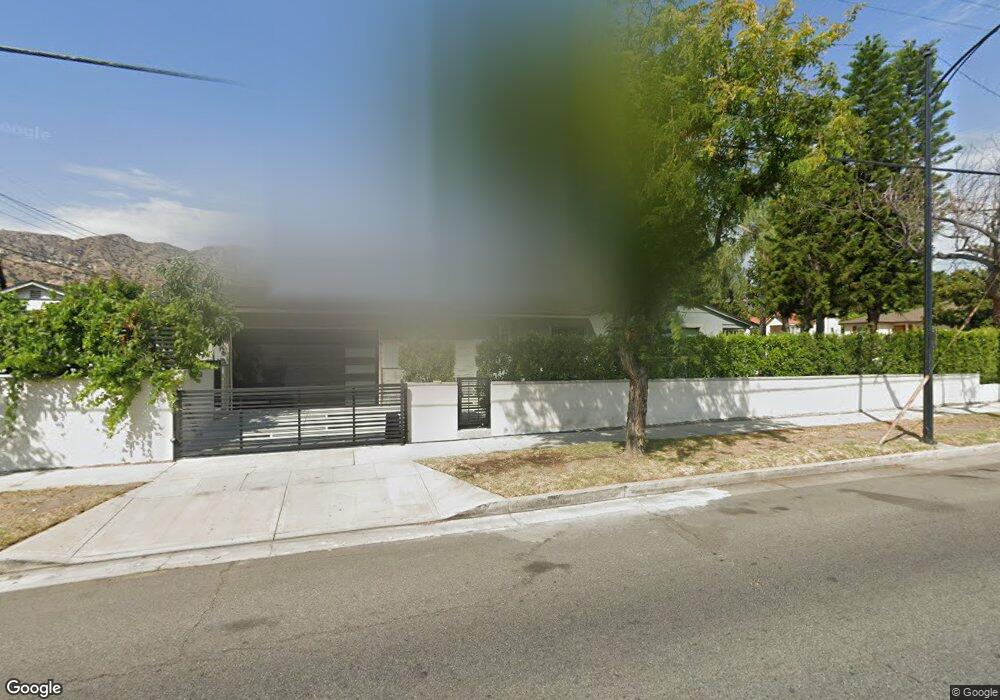
405 Cambridge Dr Burbank, CA 91504
Hillside District NeighborhoodEstimated Value: $1,173,000 - $1,459,000
3
Beds
3
Baths
1,858
Sq Ft
$710/Sq Ft
Est. Value
About This Home
This home is located at 405 Cambridge Dr, Burbank, CA 91504 and is currently estimated at $1,319,047, approximately $709 per square foot. 405 Cambridge Dr is a home located in Los Angeles County with nearby schools including Thomas Jefferson Elementary School, John Muir Middle School, and Burbank High School.
Ownership History
Date
Name
Owned For
Owner Type
Purchase Details
Closed on
May 24, 2005
Sold by
Zharazhyan Hakop
Bought by
Sarkisyan Evits
Current Estimated Value
Home Financials for this Owner
Home Financials are based on the most recent Mortgage that was taken out on this home.
Original Mortgage
$528,000
Outstanding Balance
$187,701
Interest Rate
1%
Mortgage Type
Negative Amortization
Estimated Equity
$1,131,346
Purchase Details
Closed on
Dec 10, 2003
Sold by
Pike Donald L and Pike Evelyn M
Bought by
Sarkisyan Evits
Home Financials for this Owner
Home Financials are based on the most recent Mortgage that was taken out on this home.
Original Mortgage
$412,000
Interest Rate
3.7%
Mortgage Type
Purchase Money Mortgage
Purchase Details
Closed on
Apr 27, 2001
Sold by
Pike Donald L and Pike Evelyn M
Bought by
Pike Donald L and Pike Evelyn M
Create a Home Valuation Report for This Property
The Home Valuation Report is an in-depth analysis detailing your home's value as well as a comparison with similar homes in the area
Home Values in the Area
Average Home Value in this Area
Purchase History
| Date | Buyer | Sale Price | Title Company |
|---|---|---|---|
| Sarkisyan Evits | -- | United Title Company | |
| Sarkisyan Evits | $515,000 | Gateway Title Company | |
| Pike Donald L | -- | -- | |
| Pike Donald L | -- | -- |
Source: Public Records
Mortgage History
| Date | Status | Borrower | Loan Amount |
|---|---|---|---|
| Open | Sarkisyan Evits | $528,000 | |
| Closed | Sarkisyan Evits | $412,000 | |
| Closed | Sarkisyan Evits | $51,500 |
Source: Public Records
Tax History
| Year | Tax Paid | Tax Assessment Tax Assessment Total Assessment is a certain percentage of the fair market value that is determined by local assessors to be the total taxable value of land and additions on the property. | Land | Improvement |
|---|---|---|---|---|
| 2025 | $8,206 | $732,202 | $639,796 | $92,406 |
| 2024 | $8,206 | $717,846 | $627,251 | $90,595 |
| 2023 | $8,120 | $703,771 | $614,952 | $88,819 |
| 2022 | $7,756 | $689,973 | $602,895 | $87,078 |
| 2021 | $7,722 | $676,445 | $591,074 | $85,371 |
| 2019 | $7,414 | $656,384 | $573,544 | $82,840 |
| 2018 | $7,265 | $643,515 | $562,299 | $81,216 |
| 2016 | $6,896 | $618,528 | $540,465 | $78,063 |
| 2015 | $6,756 | $609,238 | $532,347 | $76,891 |
| 2014 | $6,746 | $597,305 | $521,920 | $75,385 |
Source: Public Records
Map
Nearby Homes
- 441 Dartmouth Rd
- 505 Cambridge Dr
- 1814 Grismer Ave
- 501 Birmingham Rd
- 1711 Grismer Ave Unit 72
- 430 Tufts Ave
- 1515 Grismer Ave Unit 102
- 1515 Grismer Ave Unit 302
- 1901 Peyton Ave Unit N
- 1719 Landis St
- 2014 Peyton Ave
- 1924 N Parish Place
- 2316 N Parish Place
- 2227 N Lamer St
- 2615 Woodstock Ln
- 1304 N Griffith Park Dr
- 2444 N Parish Place
- 2109 N Lincoln St
- 227 E Burbank Blvd Unit C
- 718 E Walnut Ave
- 409 Cambridge Dr
- 411 Cambridge Dr
- 400 Dartmouth Rd
- 415 Cambridge Dr
- 406 Dartmouth Rd
- 410 Dartmouth Rd
- 419 Cambridge Dr
- 400 Cambridge Dr
- 1801 N Glenoaks Blvd Unit 1805 North Glenoaks Blvd
- 1801 N Glenoaks Blvd
- 408 Cambridge Dr
- 416 Dartmouth Rd
- 412 Cambridge Dr
- 424 Dartmouth Rd
- 423 Cambridge Dr
- 1727 N Glenoaks Blvd
- 416 Cambridge Dr
- 1832 Scott Rd Unit 1832
- 1832 Scott Rd Unit 1838
- 1832 Scott Rd
Your Personal Tour Guide
Ask me questions while you tour the home.