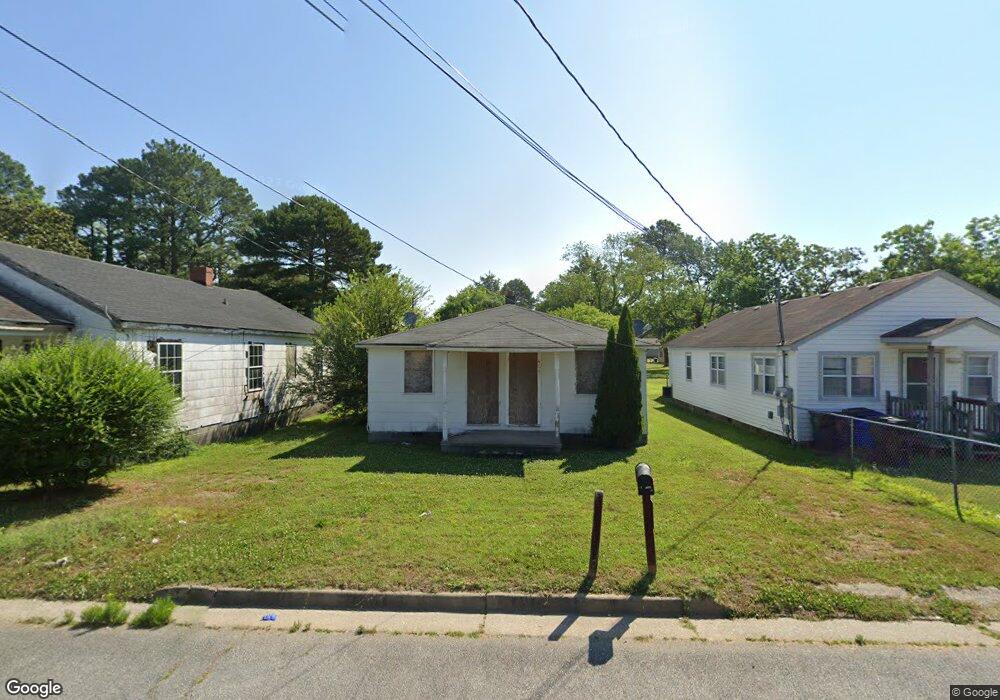
405 Cobb St Franklin, VA 23851
Estimated Value: $153,000 - $199,000
2
Beds
2
Baths
1,040
Sq Ft
$174/Sq Ft
Est. Value
About This Home
This home is located at 405 Cobb St, Franklin, VA 23851 and is currently estimated at $180,667, approximately $173 per square foot. 405 Cobb St is a home located in Franklin City with nearby schools including S.P. Morton Elementary School, Joseph P. King Jr. Middle School, and Franklin High School.
Ownership History
Date
Name
Owned For
Owner Type
Purchase Details
Closed on
Aug 28, 2025
Sold by
Hampton House Buyers Llc
Bought by
Nasif Trent Hakim
Current Estimated Value
Home Financials for this Owner
Home Financials are based on the most recent Mortgage that was taken out on this home.
Original Mortgage
$6,300
Outstanding Balance
$5,717
Interest Rate
6.75%
Mortgage Type
New Conventional
Estimated Equity
$174,950
Purchase Details
Closed on
Apr 23, 2024
Sold by
Barnes Beverly L and Barnes Beverly A
Bought by
Hampton House Buyers Llc
Home Financials for this Owner
Home Financials are based on the most recent Mortgage that was taken out on this home.
Original Mortgage
$491,600
Interest Rate
6.88%
Mortgage Type
Construction
Create a Home Valuation Report for This Property
The Home Valuation Report is an in-depth analysis detailing your home's value as well as a comparison with similar homes in the area
Home Values in the Area
Average Home Value in this Area
Purchase History
| Date | Buyer | Sale Price | Title Company |
|---|---|---|---|
| Nasif Trent Hakim | $180,000 | First American Title | |
| Hampton House Buyers Llc | $160,000 | First American Title |
Source: Public Records
Mortgage History
| Date | Status | Borrower | Loan Amount |
|---|---|---|---|
| Open | Nasif Trent Hakim | $6,300 | |
| Open | Nasif Trent Hakim | $176,739 | |
| Previous Owner | Hampton House Buyers Llc | $491,600 |
Source: Public Records
Tax History
| Year | Tax Paid | Tax Assessment Tax Assessment Total Assessment is a certain percentage of the fair market value that is determined by local assessors to be the total taxable value of land and additions on the property. | Land | Improvement |
|---|---|---|---|---|
| 2025 | $237 | $23,000 | $16,500 | $6,500 |
| 2024 | -- | $23,000 | $16,500 | $6,500 |
| 2023 | $148 | $14,400 | $9,400 | $5,000 |
| 2022 | $148 | $14,400 | $9,400 | $5,000 |
| 2021 | $144 | $14,000 | $8,500 | $5,500 |
| 2020 | $217 | $14,000 | $8,500 | $5,500 |
| 2019 | $217 | $21,900 | $8,500 | $13,400 |
| 2018 | $217 | $21,900 | $8,500 | $13,400 |
| 2017 | $373 | $37,700 | $16,200 | $21,500 |
| 2016 | $373 | $37,700 | $16,200 | $21,500 |
| 2015 | -- | $0 | $0 | $0 |
| 2014 | -- | $0 | $0 | $0 |
| 2013 | -- | $0 | $0 | $0 |
Source: Public Records
Map
Nearby Homes
Your Personal Tour Guide
Ask me questions while you tour the home.