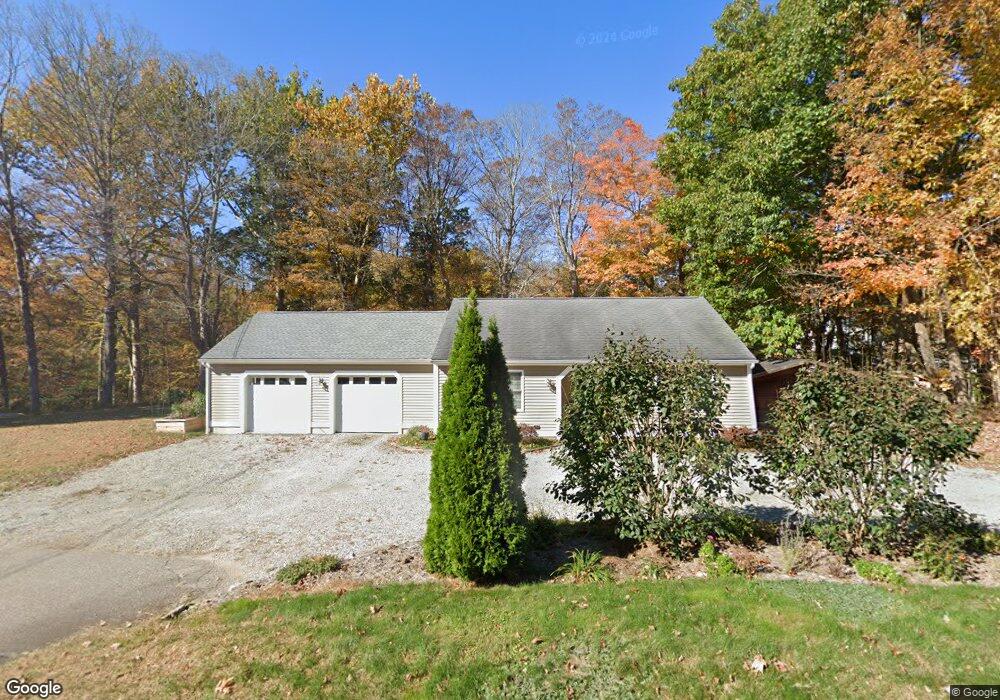
405 E Haddam Moodus Rd Moodus, CT 06469
Estimated Value: $304,694 - $332,000
2
Beds
2
Baths
990
Sq Ft
$318/Sq Ft
Est. Value
About This Home
This home is located at 405 E Haddam Moodus Rd, Moodus, CT 06469 and is currently estimated at $315,174, approximately $318 per square foot. 405 E Haddam Moodus Rd is a home located in Middlesex County with nearby schools including East Haddam Elementary School, Nathan Hale-Ray Middle School, and Nathan Hale-Ray High School.
Ownership History
Date
Name
Owned For
Owner Type
Purchase Details
Closed on
Aug 30, 2021
Sold by
Monroe Kathy and Monroe Shawn
Bought by
Annino Cody W and Skinner Rebecca
Current Estimated Value
Home Financials for this Owner
Home Financials are based on the most recent Mortgage that was taken out on this home.
Original Mortgage
$192,000
Outstanding Balance
$174,059
Interest Rate
2.7%
Mortgage Type
Stand Alone Refi Refinance Of Original Loan
Estimated Equity
$141,115
Purchase Details
Closed on
Sep 8, 2017
Sold by
Kito Realty Llc
Bought by
Monroe Shawn and Monroe Kathy
Purchase Details
Closed on
Jun 29, 2007
Sold by
Indellicati Lori and Darvas Christian
Bought by
Kito Realty Llc
Create a Home Valuation Report for This Property
The Home Valuation Report is an in-depth analysis detailing your home's value as well as a comparison with similar homes in the area
Home Values in the Area
Average Home Value in this Area
Purchase History
| Date | Buyer | Sale Price | Title Company |
|---|---|---|---|
| Annino Cody W | -- | None Available | |
| Annino Cody W | -- | None Available | |
| Monroe Shawn | $42,000 | -- | |
| Kito Realty Llc | $162,500 | -- | |
| Monroe Shawn | $42,000 | -- | |
| Kito Realty Llc | $162,500 | -- |
Source: Public Records
Mortgage History
| Date | Status | Borrower | Loan Amount |
|---|---|---|---|
| Open | Annino Cody W | $192,000 | |
| Closed | Annino Cody W | $192,000 | |
| Previous Owner | Kito Realty Llc | $200,000 |
Source: Public Records
Tax History
| Year | Tax Paid | Tax Assessment Tax Assessment Total Assessment is a certain percentage of the fair market value that is determined by local assessors to be the total taxable value of land and additions on the property. | Land | Improvement |
|---|---|---|---|---|
| 2025 | $4,266 | $152,030 | $59,490 | $92,540 |
| 2024 | $4,068 | $152,030 | $59,490 | $92,540 |
| 2023 | $3,915 | $152,030 | $59,490 | $92,540 |
| 2022 | $4,049 | $127,360 | $47,210 | $80,150 |
| 2021 | $4,507 | $148,050 | $68,670 | $79,380 |
| 2020 | $4,507 | $148,050 | $68,670 | $79,380 |
| 2019 | $4,507 | $148,050 | $68,670 | $79,380 |
| 2018 | $3,762 | $126,840 | $68,670 | $58,170 |
| 2017 | $3,675 | $124,250 | $68,670 | $55,580 |
| 2016 | $3,647 | $124,250 | $68,670 | $55,580 |
| 2015 | $3,563 | $124,250 | $68,670 | $55,580 |
| 2014 | $3,467 | $124,250 | $68,670 | $55,580 |
Source: Public Records
Map
Nearby Homes
- 10 Highland Ave
- 5 Joe Williams Rd
- 5 Pinehurst Ln Unit 5
- 8 Augusta Cir Unit 8
- 122 Falls Rd
- 141 Sillimanville Rd
- 80 Orchard Rd
- 52 Alger Rd
- 53 Falls Bashan Rd
- 80 Sillimanville Rd
- 154 Falls Rd
- 90 Falls Bashan Rd
- 76 White Sands Rd
- 2 Morgan Ln
- 206 N Moodus Rd
- 8 Tom Rd
- 55 Bogel Rd
- 00 Mount Parnassus Rd
- 195A Injun Hollow Rd
- 289 Young St
- 400 E Haddam Moodus Rd
- 100 Moodus Leesville Rd
- 64 Neptune Ave
- 121 Moodus Leesville Rd
- 121 Leesville Rd
- 0 Moodus Leesville Rd Unit M9110564
- 0 Moodus Leesville Rd Unit M9140977
- 0 Moodus Leesville Rd Unit N10116630
- 0 Moodus Leesville Rd Unit N10164657
- 0 Moodus Leesville Rd Unit N10164652
- 0 Moodus Leesville Rd Unit N10164395
- 0 Moodus Leesville Rd Unit N10164393
- 0 Moodus Leesville Rd Unit N10164371
- 125 Moodus Leesville Rd
- 123 Moodus Leesville Rd
- 103 Moodus Leesville Rd
- 396 E Haddam Moodus Rd
- 397 E Haddam Moodus Rd
- 418 E Haddam Moodus Rd
- 420 E Haddam Moodus Rd
Your Personal Tour Guide
Ask me questions while you tour the home.