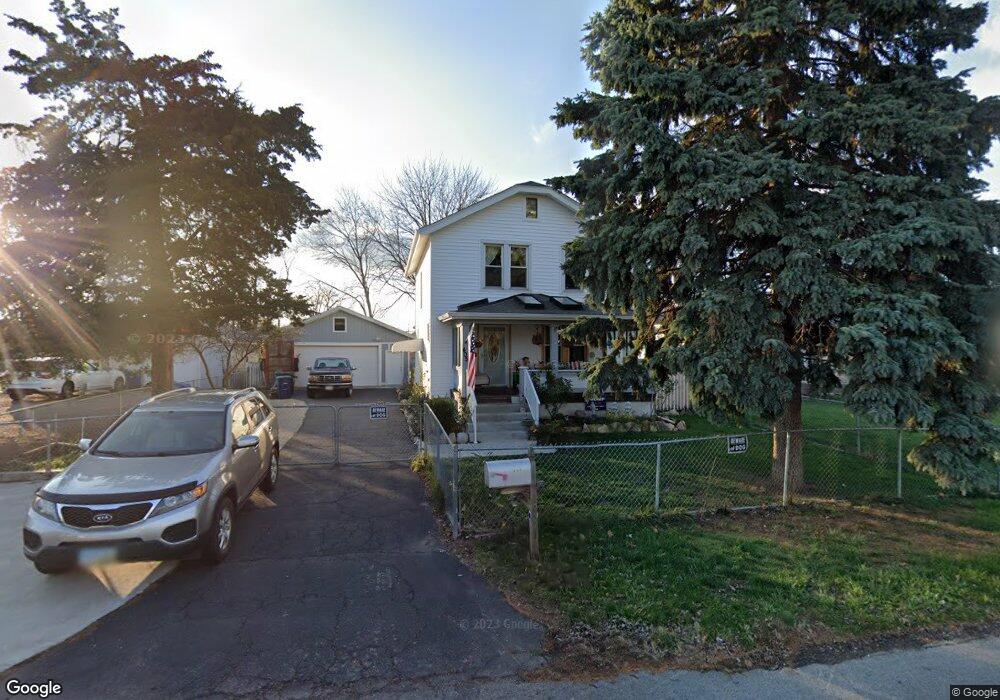
405 Josephine Ave Columbus, OH 43204
Westgate NeighborhoodEstimated Value: $231,938 - $259,000
3
Beds
2
Baths
1,334
Sq Ft
$180/Sq Ft
Est. Value
About This Home
This home is located at 405 Josephine Ave, Columbus, OH 43204 and is currently estimated at $240,735, approximately $180 per square foot. 405 Josephine Ave is a home located in Franklin County with nearby schools including Westgate Alternative Elementary School, Westmoor Middle School, and West High School.
Ownership History
Date
Name
Owned For
Owner Type
Purchase Details
Closed on
Feb 24, 2018
Sold by
Anderson Roy L
Bought by
Anderson Roy L and Anderson Peter Kathy
Current Estimated Value
Home Financials for this Owner
Home Financials are based on the most recent Mortgage that was taken out on this home.
Original Mortgage
$100,001
Outstanding Balance
$85,221
Interest Rate
4.15%
Mortgage Type
VA
Estimated Equity
$155,514
Purchase Details
Closed on
Jul 14, 2006
Sold by
Simpkins Gwendolyn M
Bought by
Anderson Roy L
Home Financials for this Owner
Home Financials are based on the most recent Mortgage that was taken out on this home.
Original Mortgage
$111,047
Interest Rate
6.73%
Mortgage Type
VA
Purchase Details
Closed on
Oct 2, 1997
Sold by
Simpkins Orville J and Simpkins Gwendolyn M
Bought by
Simpkins Orville J and Simpkins Gwendolyn M
Purchase Details
Closed on
Sep 3, 1969
Bought by
Simpkins Orville J
Create a Home Valuation Report for This Property
The Home Valuation Report is an in-depth analysis detailing your home's value as well as a comparison with similar homes in the area
Home Values in the Area
Average Home Value in this Area
Purchase History
| Date | Buyer | Sale Price | Title Company |
|---|---|---|---|
| Anderson Roy L | -- | Elite Land Title | |
| Anderson Roy L | $107,500 | None Available | |
| Simpkins Orville J | -- | -- | |
| Simpkins Orville J | -- | -- |
Source: Public Records
Mortgage History
| Date | Status | Borrower | Loan Amount |
|---|---|---|---|
| Open | Anderson Roy L | $100,001 | |
| Closed | Anderson Roy L | $111,047 |
Source: Public Records
Tax History Compared to Growth
Tax History
| Year | Tax Paid | Tax Assessment Tax Assessment Total Assessment is a certain percentage of the fair market value that is determined by local assessors to be the total taxable value of land and additions on the property. | Land | Improvement |
|---|---|---|---|---|
| 2024 | $3,247 | $72,350 | $10,820 | $61,530 |
| 2023 | $3,206 | $72,345 | $10,815 | $61,530 |
| 2022 | $2,527 | $48,720 | $12,390 | $36,330 |
| 2021 | $2,531 | $48,720 | $12,390 | $36,330 |
| 2020 | $2,535 | $48,720 | $12,390 | $36,330 |
| 2019 | $2,474 | $40,780 | $10,330 | $30,450 |
| 2018 | $2,198 | $40,780 | $10,330 | $30,450 |
| 2017 | $2,298 | $40,780 | $10,330 | $30,450 |
| 2016 | $2,124 | $32,060 | $8,260 | $23,800 |
| 2015 | $1,928 | $32,060 | $8,260 | $23,800 |
| 2014 | $1,933 | $32,060 | $8,260 | $23,800 |
| 2013 | $1,058 | $35,595 | $9,170 | $26,425 |
Source: Public Records
Map
Nearby Homes
- 328 S Southampton Ave
- 3300-3302 Sullivant Ave
- 585 Athens Ave
- 3276-3278 Sullivant Ave
- 617 Athens St
- 695 Demorest Rd
- 195 S Sylvan Ave
- 253 Powhatan Ave
- 164 Alice Rita St
- 756 Brixham Rd
- 56 Broadlawn Ave
- 79 S Southampton Ave
- 0 S Brinker Ave
- 43 Letchworth Ave
- 30 Demorest Rd
- 3874 Eakin Rd
- 781 Stephen Dr W
- 267 S Westgate Ave
- 133 S Brinker Ave
- 737 S Brinker Ave
- 411 Josephine Ave
- 393 Josephine Ave
- 385 Josephine Ave
- 439 Josephine Ave
- 400 Josephine Ave
- 3524 Westway Dr
- 377 Josephine Ave
- 3515 Westway Dr
- 418 Josephine Ave
- 435 Josephine Ave
- 3516 Westway Dr
- 369 Josephine Ave
- 426 Josephine Ave
- 378 Josephine Ave
- 3511 Westway Dr
- 434 Josephine Ave
- 3510 Westway Dr
- 370 Josephine Ave
- 3503 Westway Dr
- 3502 Westway Dr