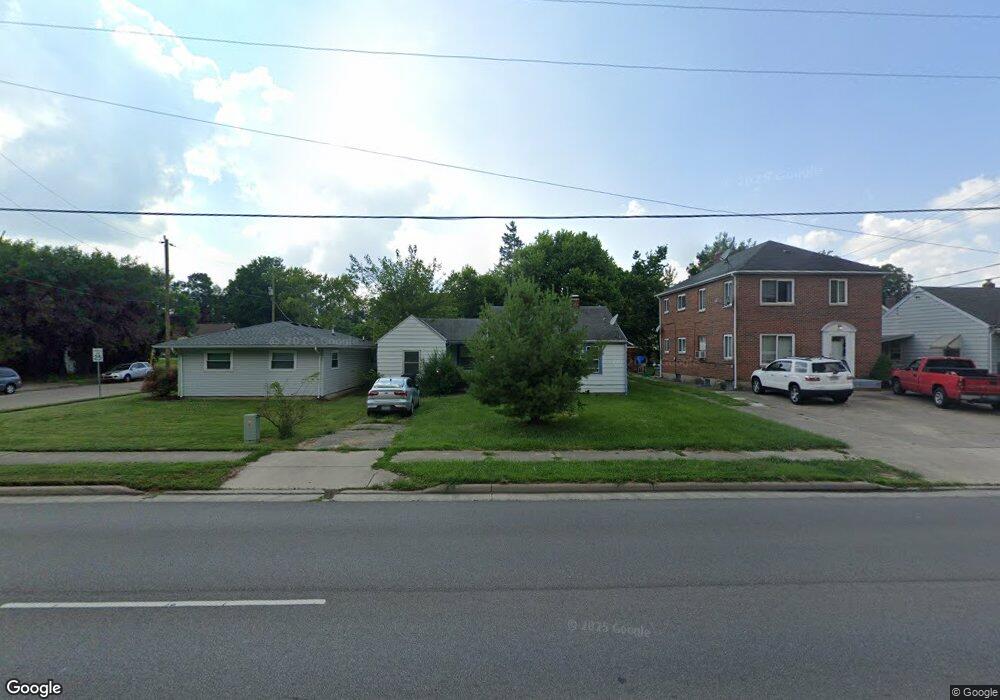
405 N Main St Franklin, OH 45005
Estimated Value: $110,000 - $160,000
1
Bed
1
Bath
728
Sq Ft
$182/Sq Ft
Est. Value
About This Home
This home is located at 405 N Main St, Franklin, OH 45005 and is currently estimated at $132,462, approximately $181 per square foot. 405 N Main St is a home located in Warren County with nearby schools including Franklin High School.
Ownership History
Date
Name
Owned For
Owner Type
Purchase Details
Closed on
Mar 7, 2011
Sold by
The Bank Of New York Mellon
Bought by
Broughton Garrett
Current Estimated Value
Purchase Details
Closed on
Dec 13, 2010
Sold by
Rowland David W and Case #10Cv76813
Bought by
The Bank Of New York Mellon
Purchase Details
Closed on
Oct 11, 2005
Sold by
Rowland Geneva C and Rowland Christine
Bought by
Rowland David W
Home Financials for this Owner
Home Financials are based on the most recent Mortgage that was taken out on this home.
Original Mortgage
$72,000
Interest Rate
5.83%
Mortgage Type
Stand Alone First
Purchase Details
Closed on
Dec 29, 1993
Sold by
Titsch Virginia R and Titsch Virginia R
Bought by
Rowland and Rowland William W
Purchase Details
Closed on
Dec 31, 1984
Sold by
Lamb Lamb and Lamb Taylor
Bought by
Titsch Titsch and Titsch Virginia R
Create a Home Valuation Report for This Property
The Home Valuation Report is an in-depth analysis detailing your home's value as well as a comparison with similar homes in the area
Home Values in the Area
Average Home Value in this Area
Purchase History
| Date | Buyer | Sale Price | Title Company |
|---|---|---|---|
| Broughton Garrett | $14,500 | Omega Title Agency | |
| The Bank Of New York Mellon | $46,667 | None Available | |
| Rowland David W | -- | Residential Title Solutions | |
| Rowland | $38,000 | -- | |
| Titsch Titsch | -- | -- |
Source: Public Records
Mortgage History
| Date | Status | Borrower | Loan Amount |
|---|---|---|---|
| Previous Owner | Rowland David W | $72,000 |
Source: Public Records
Tax History Compared to Growth
Tax History
| Year | Tax Paid | Tax Assessment Tax Assessment Total Assessment is a certain percentage of the fair market value that is determined by local assessors to be the total taxable value of land and additions on the property. | Land | Improvement |
|---|---|---|---|---|
| 2024 | $1,822 | $32,730 | $11,360 | $21,370 |
| 2023 | $1,409 | $23,947 | $6,440 | $17,507 |
| 2022 | $1,384 | $23,947 | $6,440 | $17,507 |
| 2021 | $1,318 | $23,947 | $6,440 | $17,507 |
| 2020 | $1,198 | $19,009 | $5,114 | $13,895 |
| 2019 | $1,103 | $19,009 | $5,114 | $13,895 |
| 2018 | $1,105 | $19,009 | $5,114 | $13,895 |
| 2017 | $1,139 | $17,997 | $4,911 | $13,087 |
| 2016 | $1,159 | $17,997 | $4,911 | $13,087 |
| 2015 | $579 | $17,997 | $4,911 | $13,087 |
| 2014 | $1,048 | $18,000 | $4,910 | $13,090 |
| 2013 | $904 | $20,820 | $5,680 | $15,140 |
Source: Public Records
Map
Nearby Homes
- 102 Warren Ave
- 315 Bridge St
- 121 Boys Ave
- 228 Bridge St
- 0 Victoria Dr Unit 942075
- 0 Victoria Dr Unit 1852824
- 42 N River St
- 1012 Gribble Dr
- 209 Rossman Ct
- 212 Rossman Ct
- 324 Cris Ct
- 413 Spring Ave
- 56 Skokiaan Dr
- 551 E 2nd St
- 605 Spring Ave
- 410 Park Ave
- 520 Arlington Ave
- 509 Forest Ave
- 511 Forest Ave
- 104 Mound Builder Place
- 99 W Bryant Ave
- 411 N Main St
- 413 N Main St
- 101 W Bryant Ave
- 451 N Main St
- 311 N Main St
- 453 N Main St
- 107 W Bryant Ave
- 309 N Main St
- 106 Warren Ave
- 108 Warren Ave
- 104 W Bryant Ave
- 117 W Bryant Ave
- 110 Warren Ave
- 501 N Main St
- 1 E Bryant Ave
- 108 W Bryant Ave
- 116 Warren Ave
- 119 W Bryant Ave
- 2 E Bryant Ave