W
Seller's Agent in 2025
Wohn Harden
PRG, Realtors
(832) 596-2100
1 in this area
31 Total Sales
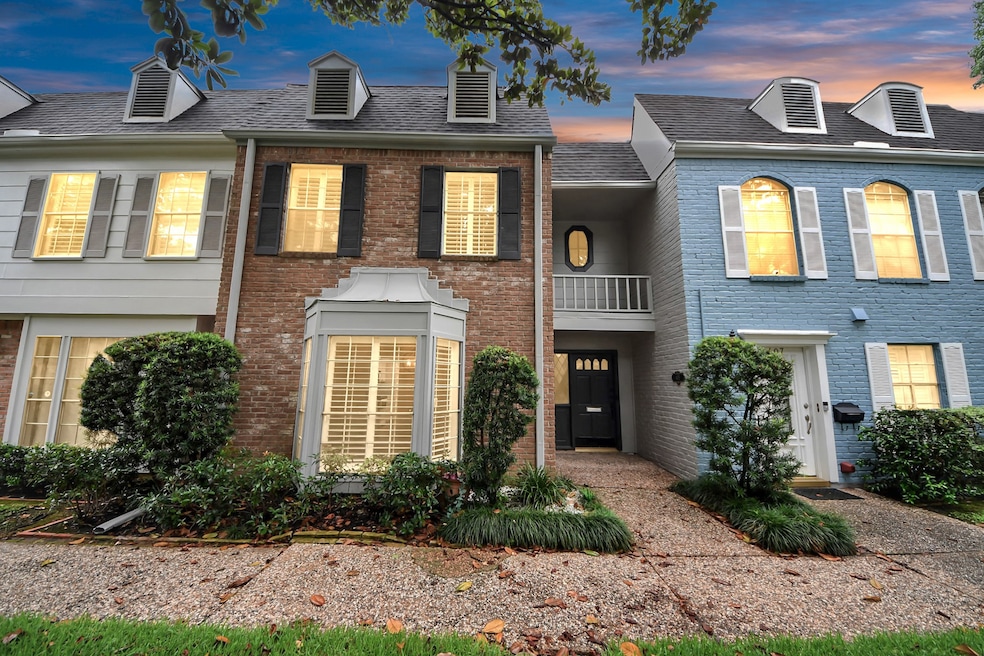

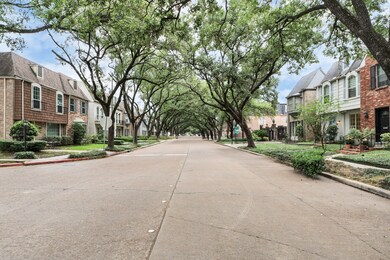
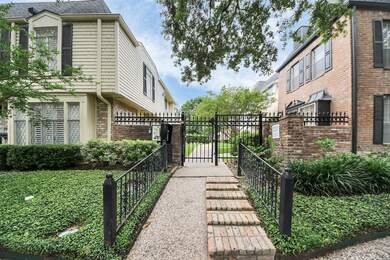
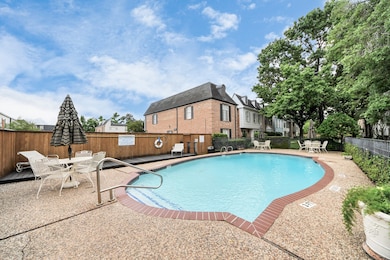

LOCATION! This FRESHLY PAINTED townhome is move-in ready, located in a lovely complex on a tree-lined street zoned for top-rated schools: Hunters Creek, Spring Branch, & Memorial High. Enjoy all utilities included in the HOA fee (excluding internet) & a prime location just mins from the Galleria, Uptown Park, Memorial Park, & River Oaks District. Inside, you'll find a spacious living-room w/ a charming brick accent wall & double French doors leading to a private patio, perfect for indoor-outdoor living. The kitchen is perfectly situated between the living & dining rooms, w/ a half bath for guests on the main floor. Upstairs, the expansive primary suite includes room for a sitting area, large walk-in closet, & views of the courtyard & pool. Both secondary bdms are spacious w/ large walk-in closets. Additionally, this home comes w/ a NEW REFRIGERATOR, WASHER & DRYER, ELFA’S FUNCTIONAL STORAGE SYSTEMS & attached carport w/ assigned spaces in a gated community. NEVER FLOODED! A MUST SEE
| Date | Type | Sale Price | Title Company |
|---|---|---|---|
| Deed | -- | None Listed On Document | |
| Interfamily Deed Transfer | -- | None Available | |
| Warranty Deed | -- | First Amer Title Tanglewood | |
| Vendors Lien | -- | Ameripoint Title | |
| Warranty Deed | -- | American Title Co | |
| Warranty Deed | -- | -- |
| Date | Status | Loan Amount | Loan Type |
|---|---|---|---|
| Open | $184,050 | New Conventional | |
| Previous Owner | $150,500 | Purchase Money Mortgage | |
| Previous Owner | $120,000 | Purchase Money Mortgage |
| Date | Event | Price | List to Sale | Price per Sq Ft |
|---|---|---|---|---|
| 10/17/2025 10/17/25 | Sold | -- | -- | -- |
| 08/31/2025 08/31/25 | Pending | -- | -- | -- |
| 07/29/2025 07/29/25 | Price Changed | $310,000 | -3.1% | $139 / Sq Ft |
| 07/10/2025 07/10/25 | Price Changed | $320,000 | -3.0% | $144 / Sq Ft |
| 06/16/2025 06/16/25 | Price Changed | $330,000 | -5.4% | $148 / Sq Ft |
| 05/30/2025 05/30/25 | For Sale | $349,000 | -- | $157 / Sq Ft |
| Year | Tax Paid | Tax Assessment Tax Assessment Total Assessment is a certain percentage of the fair market value that is determined by local assessors to be the total taxable value of land and additions on the property. | Land | Improvement |
|---|---|---|---|---|
| 2025 | $5,727 | $297,611 | $56,546 | $241,065 |
| 2024 | $5,727 | $259,799 | $49,362 | $210,437 |
| 2023 | $5,727 | $257,275 | $48,882 | $208,393 |
| 2022 | $5,773 | $246,915 | $50,313 | $196,602 |
| 2021 | $5,658 | $231,733 | $49,020 | $182,713 |
| 2020 | $6,464 | $262,623 | $49,898 | $212,725 |
| 2019 | $6,117 | $233,669 | $47,215 | $186,454 |
| 2018 | $2,859 | $233,669 | $47,215 | $186,454 |
| 2017 | $6,501 | $257,813 | $48,984 | $208,829 |
| 2016 | $8,923 | $341,091 | $64,807 | $276,284 |
| 2015 | $7,319 | $333,184 | $63,305 | $269,879 |
| 2014 | $7,319 | $293,799 | $55,822 | $237,977 |
W
Seller's Agent in 2025
Wohn Harden
PRG, Realtors
(832) 596-2100
1 in this area
31 Total Sales

Buyer's Agent in 2025
Jerry Flowers
LPT Realty, LLC
(832) 702-5241
1 in this area
242 Total Sales
Source: Houston Association of REALTORS®
MLS Number: 55253362
APN: 1073330000003
Disclaimer: Certain information contained herein is derived from information provided by parties other than Homes.com. All information provided is deemed reliable, but is not guaranteed to be accurate and should be independently verified.
![]() Copyright 2025, Houston REALTORS® Information Service, Inc.
Copyright 2025, Houston REALTORS® Information Service, Inc.
The information provided is exclusively for consumers’ personal, non-commercial use, and may not be used for any purpose other than to identify prospective properties consumers may be interested in purchasing.
Information is deemed reliable but not guaranteed.